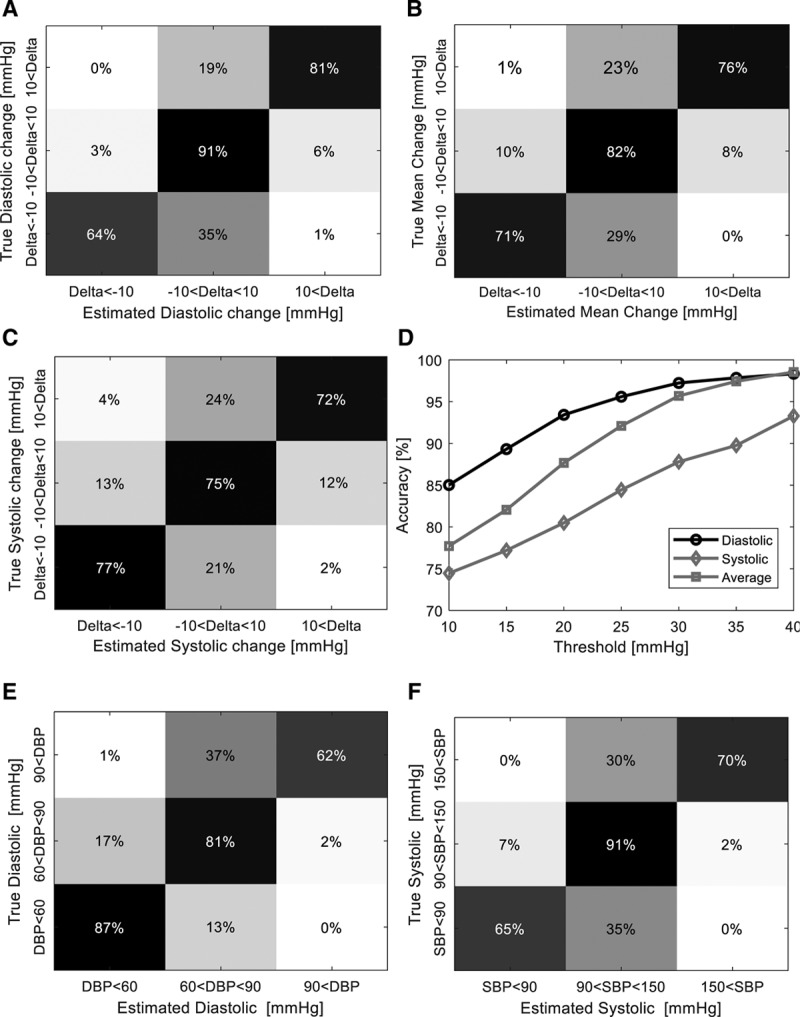
Figure 4.

Detection of clinically significant fluctuations. A, Normalized (by true class) confusion matrix showing the conditional probabilities (in percentages) of detecting a diastolic change either less than –10 mm Hg or greater than 10 mm Hg (each row is normalized to the true change summing up to 100%). Probability is denoted using a color scale with black correlating to a probability of 0 and white to a probability of 1. B, Similar normalized confusion matrix as in (A), for mean blood pressure (BP) fluctuations with a similar magnitude. C, Similar normalized confusion matrix as in (A) for systolic BP (SBP) fluctuations with a similar magnitude. D, Accuracy of detecting a clinically relevant fluctuation as a function of the fluctuation magnitude. E, Normalized confusion matrix (normalization similar to (A) showing the sensitivity of detecting diastolic hypotension, normotension, or hypertension as defined by thresholds of less than 60 mm Hg, 60–90 mm Hg, and greater than 90 mm Hg, respectively. F, Normalized confusion matrix (normalization similar to [A]) showing the sensitivity of detecting systolic hypotension, normotension, or hypertension as defined by thresholds of less than 90 mm Hg, 90–150 mm Hg, and greater than 150 mm Hg, respectively. DBP = diastolic blood pressure.
