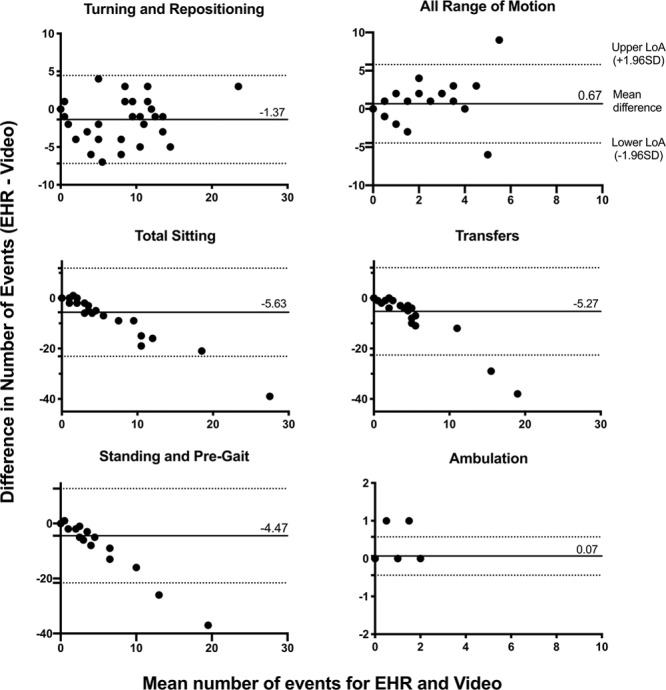
Figure 2.

Visual depiction of agreement in activity frequency between video and electronic health record (EHR) estimations per patient, according to the Bland–Altman method. Each value represents the difference in activity frequency estimates between the two methods (EHR minus Video) against the mean of the two methods. Points above the y-axis zero line indicate overestimation by the EHR, and points below the x-axis zero line indicate underestimation. The dotted lines represent the upper and lower limits of agreement (LoA) (± 1.96 sd).
