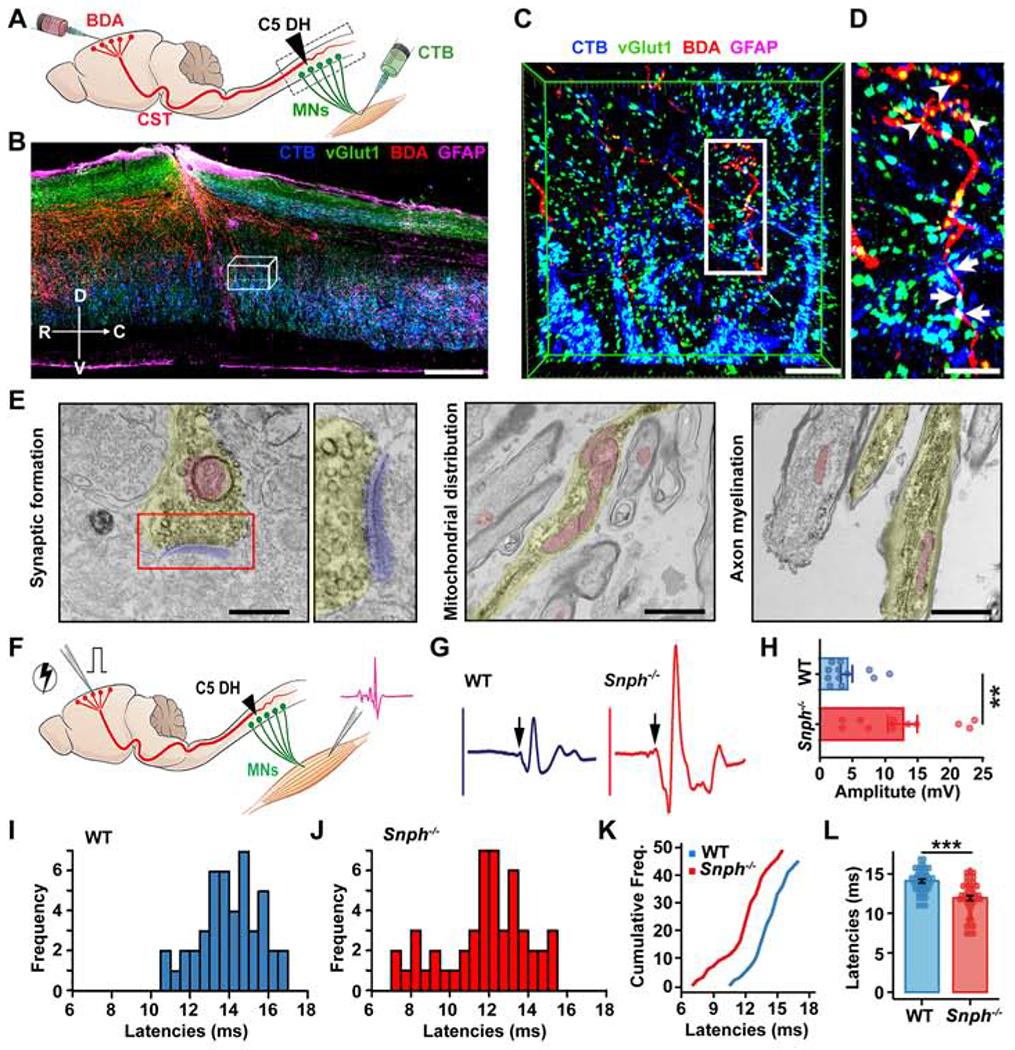
Figure 2. Regenerated CST Axons Form Functional Cortico-Motoneuron Connections.

(A) Illustration showing bilateral injections of BDA into the motor cortex to label CST axons and CTB into the bicep’s muscles to label cervical motoneurons (MNs) after the C5 DH.
(B-D) BDA-labeled regenerated CST axons (red) formed synapse-like connections (vGlut1, green) with CTB retrogradely labeled MNs (blue) caudal to the C5 DH (GFAP-IR, magenta) in Snph−/− mice. (C) 3D magnification of boxed area in B. (D) High magnification of boxed area in C. Arrowheads (in C) indicate vGlut1 distribution along BDA-labeled CST axons. Arrows indicate vGlut1 co-labeled with both BDA-labeled CST axons and CTB-labeled MNs. Compass: D, dorsal; V, ventral; R, rostral; C, caudal.
(E) Electron micrographs showing synaptic formation of regenerated CST axons in caudal spinal cords. Left: BDA-labeled CST axon (yellow colored) caudal to the lesion site that formed a presynaptic terminal containing synaptic vesicle clusters in the active zone and contacts on a postsynaptic density (blue colored). Middle: mitochondria were enriched and clustered within BDA-labeled newly growing axon tip in sections caudal to the injury. Right: BDA-labeled myelinated CST axons below the lesion.
(F-L) Schematic diagram (F) and electromyography (EMG) analysis (F-L) showing signals recorded from forelimb biceps in response to motor cortex single-pulse stimulation. Sample EMG traces (G) from WT (blue) and Snph−/− (red) mice were recorded in response to single-pulse stimulations after the C5 DH. Arrows indicate evoked-potential onset. (H) Average peak-to-peak EMG amplitude in WT (n = 12) and Snph−/− (n = 11) mice, P < 0.01. (I, J) Frequency distributions of EMG latencies from WT and Snph−/− mice, respectively. (K) Cumulative frequency distribution plot for WT (blue) and Snph−/− mice (red). (L) EMG latencies in WT (14.08 ± 0.23, n = 45 stimulation sites from 11 animals) and Snph−/− mice (11.95 ± 0.31, n = 49 stimulation sites from 10 animals).
Data were presented as mean ± sem. Unpaired two-tailed Student’s t-test. **P < 0.01, ***P < 0.001). Scale bars: 400 μm (B), 50 μm (C), 25 μm (D), 400 nm (E, left), 1200 nm, (E, middle and right). (Also see Figure S1).
