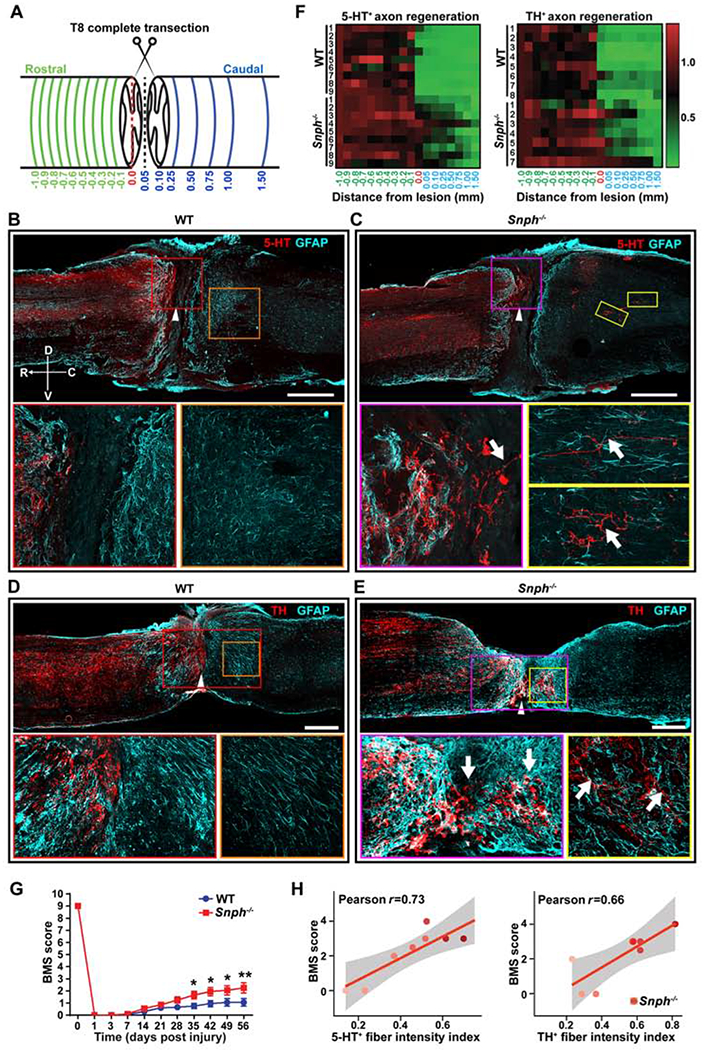
Figure 5. Monoaminergic Axon Regeneration after T8 Complete Transection in Snph−/− Mice.

(A) Diagram illustrates a complete thoracic (T8) transection model. Green lines indicate various cross-sections spaced 0.1 mm apart up to 1 mm rostral to the lesion border; blue lines indicate cross-sections at various distances caudal to the lesion border up to 1.5 mm caudal to the rostral lesion border. The red-dashed line indicates the edge of the rostral lesion border, which is set to 0 mm for both rostral and caudal directions.
(B, C) Images of 5-HT-immunoreactive (IR) serotonergic axons (red) costained for GFAP (cyan) in sagittal sections following a complete T8 transection in WT (B) and Snph−/− mice (C). Arrowheads indicate the lesion center, which was magnified in lower left panels. Lower right panels: high magnifications of boxed areas in B or C respectively. Compass: D, dorsal; V, ventral; R, rostral; C, caudal.
(D, E) TH-IR dopaminergic axons (red) costained for GFAP (cyan) in sagittal sections following T8 transection in WT (D) and Snph−/− mice (E). Arrowheads indicate the lesion centers, which were magnified in lower left panels, respectively. Lower right panels: high magnifications of boxed areas of the caudal spinal cord in D or E, respectively.
(F) Color-coded density heatmap indicates the mean intensity of 5-HT-IR and TH-IR fibers after T8 transection. The horizontal axis indicates the distance rostral and caudal to the rostral lesion border (0.0). The vertical axis indicates individual mice in WT or Snph−/− group, respectively. n = 7-9 mice/group.
(G, H) BMS scores in Snph−/− mice were significantly higher than WT mice from 35 to 56 days post-injury (*P < 0.05; ** P < 0.01) (G) and correlated to 5-HT and TH fiber intensity (r = 0.73, r = 0.06, respectively) (H). Scale bars: 500 μm (B-E). (Also see Figure S4).
