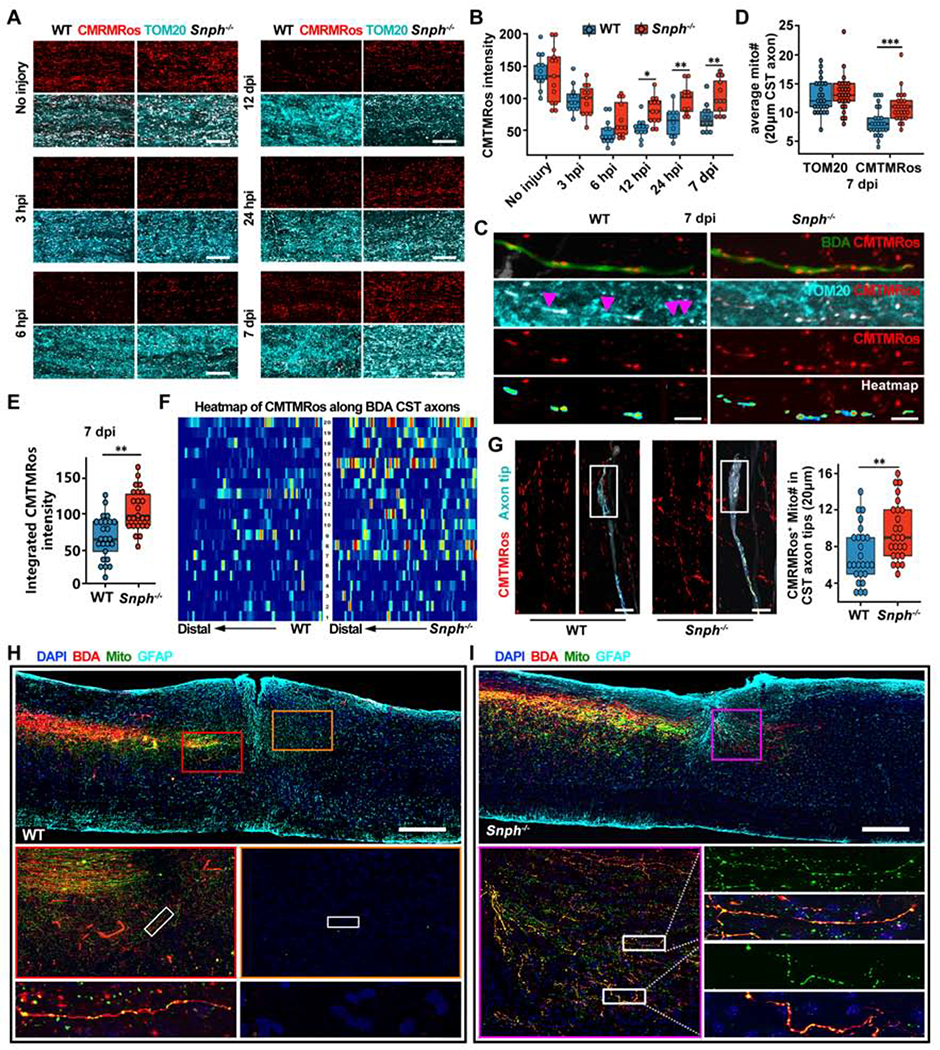
Figure 6. Snph−/− Mice Recover Local CST Axonal Mitochondrial Integrity after SCI.

(A, B) Images (A) and analysis (B) of CMTMRos-labeled polarized mitochondria over TOM20-immunostained total mitochondria in the spinal cord dorsal white matter at different times following C5 DH. Data were presented as mean ± sem; n = 3-4 mice/group at each time.
(C) Distribution of polarized mitochondria along individual BDA-labeled CST axons in the rostral lesion site vicinity at 7 days after the C5 DH (7 dpi). Arrowheads represent TOM20-positive but CMTMRos-negative depolarized mitochondria along WT axons, indicating injury-induced damage of mitochondrial integrity. CMTMRos-labeled mitochondria along CST axons were isolated and converted to color-coded heatmaps, in which red and blue indicate the highest and lowest CMTMRos fluorescent intensity, respectively.
(D) Average number of TOM20-labeled or CMTMRos-labeled mitochondria along 20 μm BDA-labeled CST axons rostral to the lesion in WT (blue) and Snph−/− mice (red) at 7 dpi. Data were presented as mean ± sem; n = 25 axons from 4 mice/group.
(E) Analysis of integrated CMTMRos fluorescence intensity within TOM20 masked area along individual BDA-labeled CST axons in WT (blue) and Snph−/− mice (red) at 7 dpi. Data were presented as mean ± sem. n = 25 axons from 4 mice/group.
(F) Pseudo-colored heatmaps represent CMTMRos-labeled mitochondria along BDA-labeled CST axons rostral to the injury in WT and Snph−/− mice at 7 dpi. In heatmaps, red and blue indicate the highest and lowest CMTMRos fluorescent intensity, respectively. n = 20 axons from 4 mice/group.
(G) CMTMRos-labeled mitochondria were distributed within growing tips of BDA-labeled CST axons 7 days after the C5 DH in WT and Snph−/− mice. Boxplot shows the average number of CMTMRos-labeled mitochondria in the distal 20 mm of CST axon tips. n = 25 axons from 4 mice/group.
(H, I) Relative distribution of motor cortex-derived mitochondria, labeled by AAV9-mito-GFP, in BDA-labeled CST axons at 8 weeks following the C5 DH in WT (H) and Snph−/− mice (I). Middle panels (H): magnification of boxed area in the top panel; Bottom panels (H): high magnification of boxed area in middle panels; lower left panel (I): magnification of boxed area in the upper panel, lower right panels (I): high magnification of boxed area in left panels.
Differences were analyzed by two-way ANOVA with Bonferroni post hoc correction (B, D) or unpaired two-tailed Student’s t-test (E, G). *P < 0.05; ** P < 0.01. ***P < 0.001. Scale bars: 20 μm (A), 5 μm (C), 10 μm (G), 500 μm (H, I). (Also see Figure S5).
