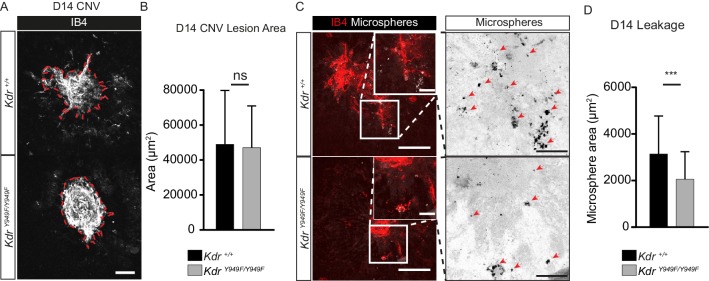
Figure 1. Reduced leakage from CNV lesions in KdrY949F/Y949F retinas at D14.
(A) Representative CNV lesions imaged from whole mount choroid tissue, collected at day (D) 14 after laser injury, from KdrY949F/Y949F and Kdr+/+ littermates, immunostained for isolectin B4 (IB4). Scale bar = 100 µm. Dotted red line highlights the extent of lesion formation. (B) Quantification of average lesion size at D14 after injury. n = 60–67 lesions per group from 9 to 11 mice per group. ns = not significant p=0.6882. (C) Representative images of D14 lesions from KdrY949F/Y949F and Kdr+/+ littermates immunostained for IB4 (red), showing accumulation of tail-vein injected, fluorescent 100 nm microspheres (white) in the tissue around the lesions. Insets enlarged (right) with microspheres shown as black dots on white background. Scale bar = 100 µm. Inset scale bar = 25 µm. Arrows point to areas of microsphere accumulation. (D) Quantification of the average area of accumulated microspheres per image after 2 min of circulation. n = 35–74 lesions per group from 7 to 14 mice per group. ***p<0.001 p=0.0006.

