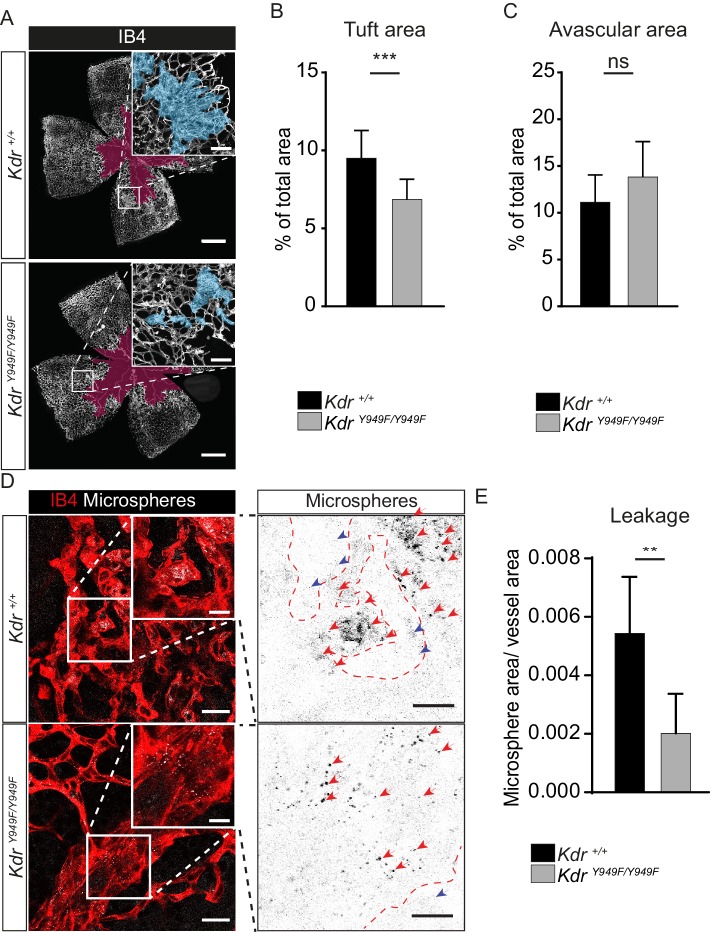
Figure 2. Reduced leakage from OIR lesions in KdrY949F/Y949F retinas at P17.
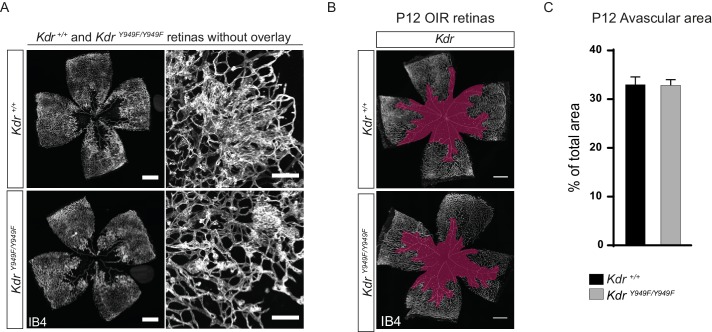
(A) Representative images of whole mount retinas from KdrY949F/Y949F and Kdr+/+ mice, collected on postnatal day (P)17 after OIR challenge, stained with isolectin B4 (IB4). Avascular tissue in the central retina is marked with purple overlay and neovascular tufts, clusters of disordered vessels, are indicated with blue overlay in the insets. See Figure 2—figure supplement 1A for corresponding images without color overlays. Scale bar = 500 µm. Inset scale bar = 100 µm. (B) Neovascular tuft coverage as percentage of total retina area. (C) Avascular area as percentage of total retina area. n = 10–14 mice, mean value of both eyes;***, p<0.00 p=0.003; ns, not significant p=0.0775. (D) Representative images of tufts from KdrY949F/Y949F and Kdr+/+ mice immunostained for isolectin B4 (IB4;red), showing accumulation of tail-vein injected green-fluorescent 25 nm microspheres (white) in the tissue around the tufts. Insets enlarged (right) with microspheres shown as black dots on white background. Scale bar = 25 µm. Inset scale bar = 10 µm. Dotted line representing the region of IB4 staining. Arrows point to accumulated microspheres; red arrows for microspheres within the IB4 positive region, blue arrows for microspheres away from the vessel wall. (E) Quantification of D, showing average area of accumulated extravasated microspheres, normalized to tuft area, per image after 15 min of circulation. n = 6–7 mice per group, 3–11 images per mouse; **p<0.01 p=0.0033.


