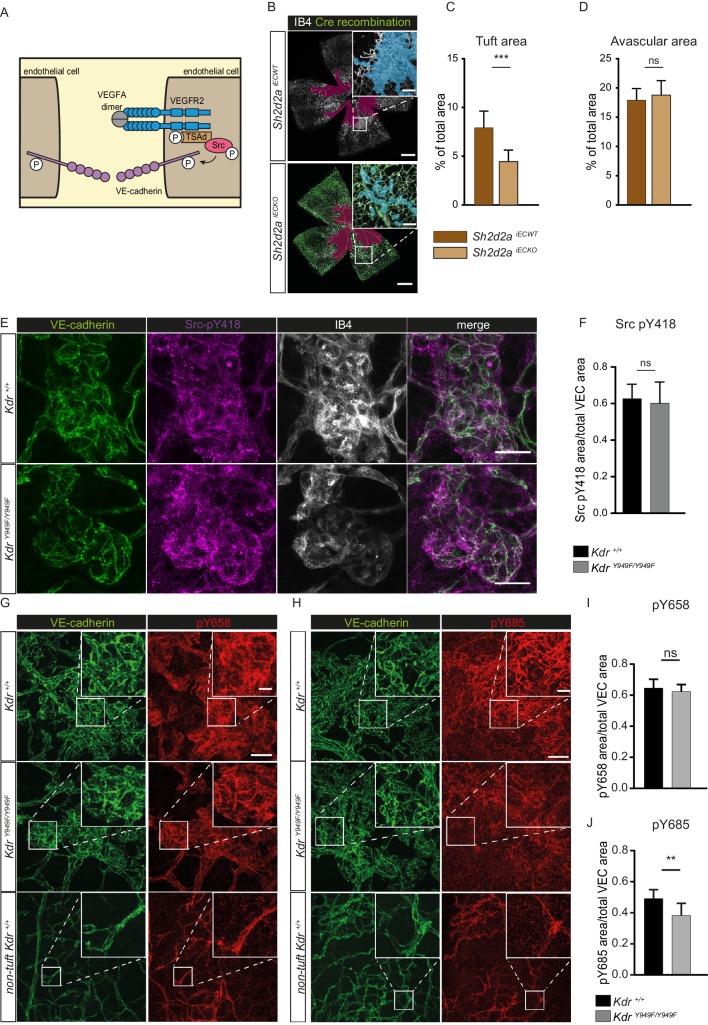
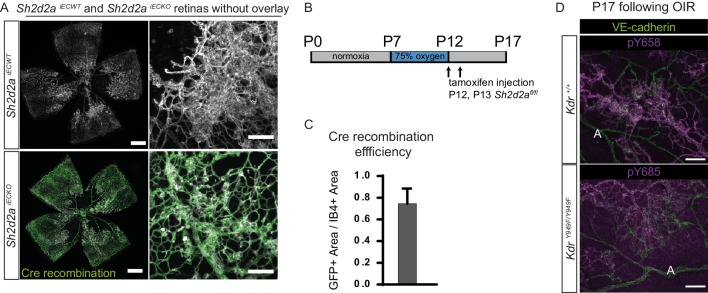
Figure 3. pY949 signaling axis involvement in retinopathy pathology.
(A) Graphic representation of VEGFR2 signaling cascade initiated by Y949 phosphorylation. (B) Representative images of whole mount retinas from Sh2d2aiECKO and Sh2d2aiECWT mice, collected on postnatal day (P)17 after OIR challenge, stained with isolectin B4 (IB4) with green color marking GFP-positive cells indicating TSAd-deficiency. Avascular area shown with purple overlay, neovascular tufts shown as blue overlay in inset. Scale bar = 500 µm. Inset scale bar = 100 µm. (C) Neovascular tuft coverage as percentage of total retina area. (D) Avascular area as percentage of total retina area. n = 10–15 mice, mean value of both eyes ***, p<0.001 p=0.0001; ns, not significant p=0.3680 E) Representative maximum intensity projections of tufts from KdrY949F/Y949F and Kdr+/+ mice immunostained for isolectin B4 (IB4; white), VE-cadherin (green), and pY418 c-Src (magenta). Scale bar = 25 µm. (F) Quantification shows percentage tuft junctional area, as defined by VE-cadherin immunostaining, positive for pY418 c-Src. n = 7–8 retinas from four mice per group; mean value from four images per retina ns = not significant p=0.6334. (G–H) Representative maximum intensity projections of tufts from KdrY949F/Y949F and Kdr+/+, as well as non-tuft regions from Kdr+/+ retinas immunostained for VE-cadherin (green) and G) VE-cadherin pY658 (red) or H) for VE-cadherin pY685 (red). (I) Quantification of percentage pY658 immunostaining in tufts, in relation to total tuft junctional (VE-cadherin) area. (J) Quantification of percentage pY685 immunostaining as in I. Scale bars in G, H = 50 µm. Inset scale bar = 10 µm. n = 4–6 mice, one retina per mouse, from three independent experiments, 5–9 images per group. ns, not significant p=0.4845, **p<0.01 p=0.0086.


