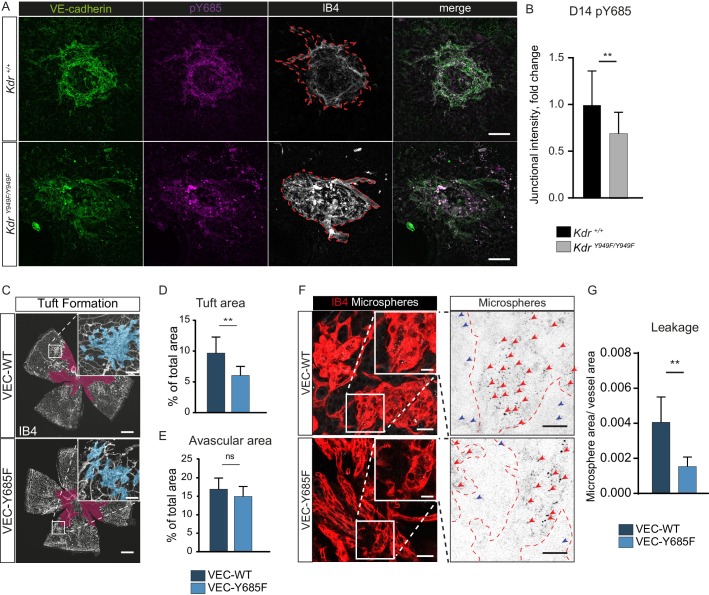
Figure 4. Involvement of VE-cadherin pY685 in lesion formation and vessel leakage.
(A) Representative CNV lesions imaged from whole mount choroid tissue, collected at D14 from KdrY949F/Y949F and Kdr+/+ littermates, immunostained for VE-cadherin (green), pY685 (magenta) and isolectin B4 (IB4; white). Scale bar = 100 µm; dotted red line highlights the extent of lesion formation in the IB4 channel. (B) Quantification of junctional pY685 immunostaining in the lesions. Junctional intensity expressed as the fold reduction of intensity as compared to the average Kdr+/+ lesion intensity. n = 14–28 lesions per group from 3 to 5 mice per group, **p<0.01 p=0.0071. (C) Whole mount retinas from VEC-Y685F mice and VEC-WT mice, collected on P17 after OIR challenge, stained for IB4. Avascular area shown with purple overlay, neovascular tufts shown as blue overlay in inset. Scale bar = 500 µm. Inset scale bar = 100 µm. (D) Tuft coverage and E) avascular area. n = 8–11 mice per group, average of two retinas per mouse. **p<0.05 p=0.0012; ns = not significant, p=0.1535. (F) Representative images of accumulation of 25 nm green-fluorescent microspheres (white) in VEC-Y685F and VEC-WT control mice stained for isolectin B4 (IB4; red), showing accumulation in the tissue around the tufts. Insets enlarged (right) with microspheres shown as black dots on white background. Scale bar = 25 µm. Inset scale bar = 10 µm. Dotted line representing the region of IB4 staining. Arrows point to accumulated microspheres; red arrows for microspheres within the IB4 positive region, blue arrows for microspheres away from the vessel wall. (G) Quantification of F showing average area of accumulated extravasated microspheres, normalized to tuft area, per image after 15 min of circulation. n = 5–7 mice per group; 10–18 images per mouse **p<0.01, p=0.0016.


