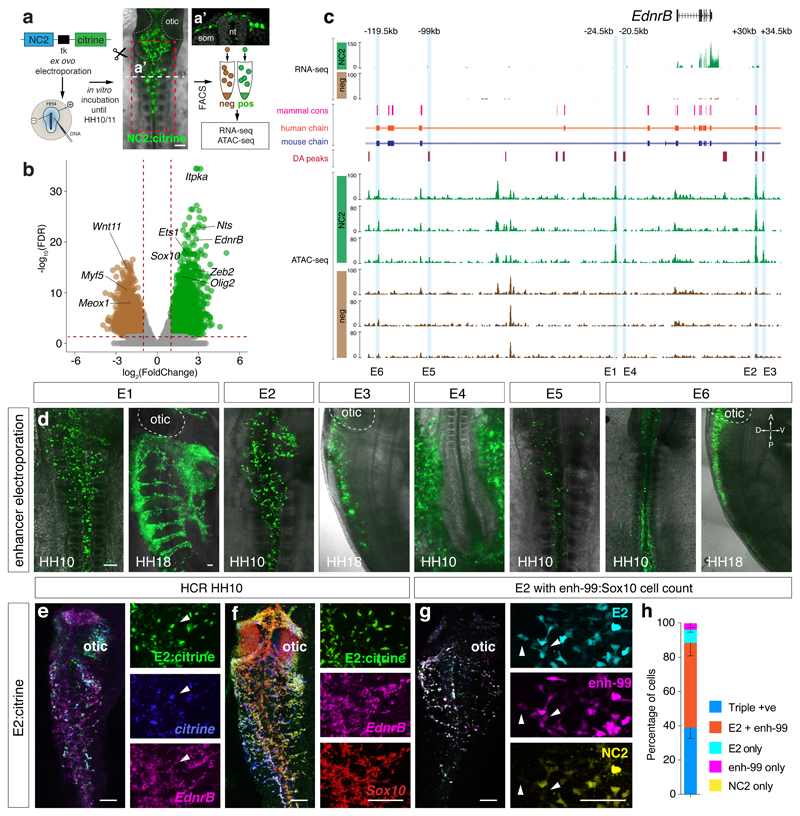
Figure 1. Defining regions of differential chromatin accessibility within VNC identifies NC specific EdnrB enhancers.
(a) Ex ovo electroporation of NC2:Citrine construct at HH4. Embryos were incubated until HH10 to reveal Citrine expression in the VNC (A’). Vagal region from somites 1-7 from approximately 90 embryos (Red box) was dissected and dissociated prior to FAC-sorting Citrine+ cells. ATAC-seq was performed on 2500 live sorted cells. Scale bar = 100 μm
(b) Volcano plot showing merged peaks from triplicates of ATAC-seq experiment differentially accessible in NC2 (green) versus negative cells (brown). Analysis using DiffBind identified peaks with statistically significant enrichment; p-values obtained using Wald test with Benjamin-Hochberg correction for multiple testing (False Discovery Rate, FDR) were plotted against the FoldChange on a log scale.
(c) Genome browser screenshot of the EdnrB locus spanning approximately 150kb showing RNA-seq and ATAC-seq tracks, differentially accessible peaks, as well as human and mouse conservation chains. Six EdnrB enhancers, E1-E6, are highlighted in blue.
(d) Live embryo confocal image of HH10 embryos electroporated ex ovo with enhancer:Citrine constructs. Orientation A, anterior, P, posterior, D, dorsal, V, ventral. 6 embryos/experiment
(e) In situ HCR of an electroporated embryo with E2:Citrine showing co-localisation with Citrine and endogenous EdnrB gene expression. 6 embryos/experiment
(f) In situ HCR of an electroporated embryo with E2:Citrine showing co-localisation with endogenous EdnrB and Sox10 gene expression. 6 embryos/experiment
(g) Live embryo confocal image of E2:mCherry, NC2:Cerulean and enh-99:mCherry (marking Sox10-expressing cells). White arrowheads mark E2/enh-99 positive cells but NC2 negative. 3 embryos/experiment
(h) Activity and overlap of three NC enhancers, E2:mCherry, NC2:Cerulean and enh-99:mCherry indicated as a percentage of all fluorescent NC cells in the vagal region (somite levels 1-7). n=3 independent embryos imaged and quantified separately using confocal images. Error bars indicate Standard Deviation. Scale bars = 100 μm.

