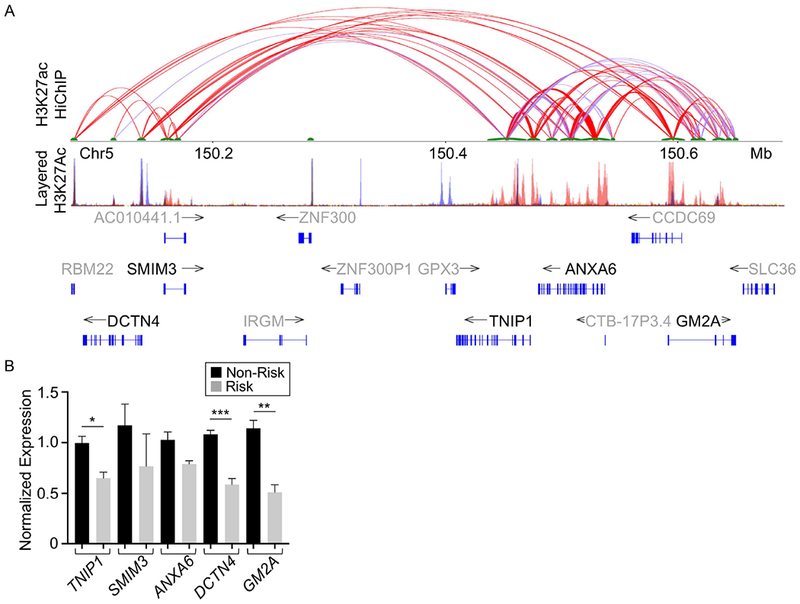
Figure 5. The TNIP1 locus has a complex regulatory structure that influences gene expression locally and at a distance.

(A) H3K27ac HiChIP looping interactions within the TNIP1 region were visualized as a two-dimensional looping diagram. Arc thickness is proportional to the frequency of observed paired-end tags (6 PET threshold). The enhancer with a strong H3K27ac ChIP peak spanning the TNIP1 gene locus forms long-range interactions with multiple H3K27ac anchors proximal to distant genes. H3K27Ac Peak Track was adapted from the UCSC Genome Browser ENCODE H3K27Ac chromatin marks for GM12878, H1-hESC, and K562 cell lines (B). Expression of distant genes in the H3K27ac regulatory network with TNIP1 was measured in resting EBV B cell lines carrying the non-risk (NR) or risk (R) H1 TNIP1 haplotype using qRT-PCR. Expression was normalized to GAPDH, then TNIP1 expression in non-risk EBV B controls. Statistical comparisons were performed using Student’s t-test, n>3, * indicates p<0.05; ** indicates p<0.01; *** indicates p<0.001.
