
Figure 3.
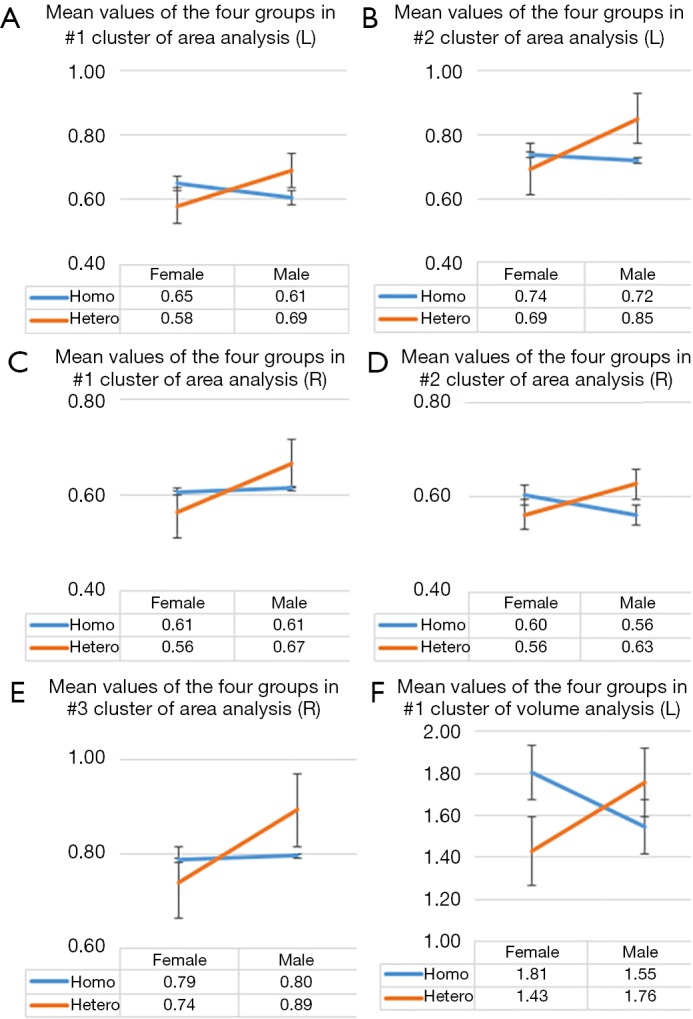
The intersection in every graph comparing group means among homosexual women, heterosexual women, heterosexual men, and homosexual men showing an interaction effect between two factors: sexual orientation and gender. The group means were calculated from the average surface area of (A) the first cluster and (B) the second cluster in the left hemisphere, and the average surface area of (C) the first cluster, (D) the second cluster, and (E) the third cluster in the right hemisphere, and the average volume of (F) the cluster in the left hemisphere (Table 2).