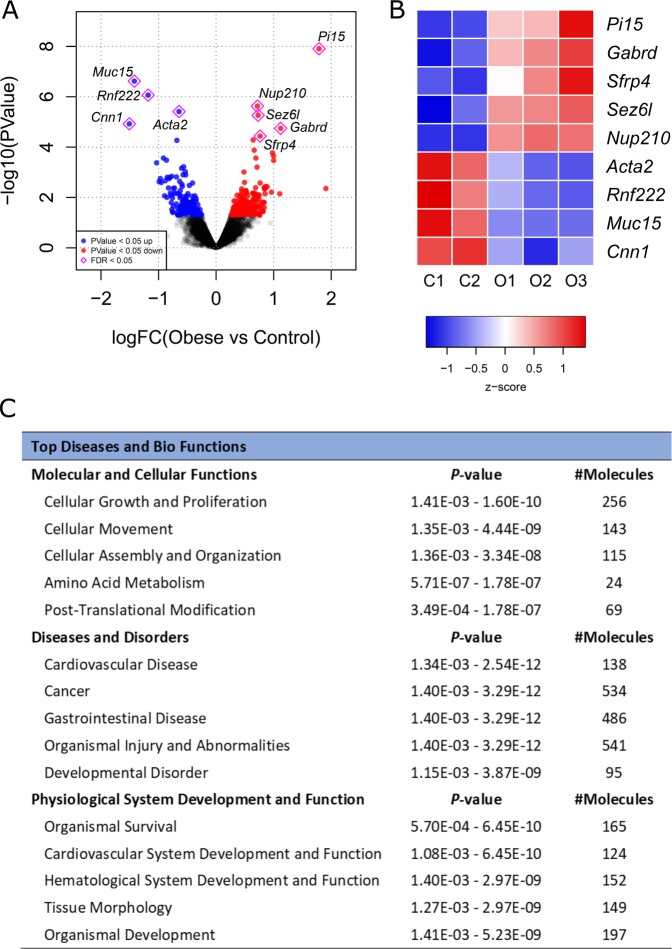
Fig. 1. RNA-seq identification of differentially expressed genes between Control (C, n = 2) and Obese (O, n = 3) male mouse placentae at E19.
a Volcano plot representing all detected transcripts, distributed according to −log10 P value in the y-axis and log2 fold change in the x-axis, with downregulated genes shifted to the left (P < 0.05 in blue) and upregulated genes shifted to the right (P < 0.05 in red). Significantly altered genes after correction for multiple testing (FDR < 0.05) are depicted with a pink diamond. b Heatmap representation of genes significantly regulated by maternal obesity using a cutoff FDR < 0.05, with scaled Z-score color key of normalized counts showing expression levels ranging from blue (lower) to red (higher). Genes are sorted from lowest to highest log2 fold change value. c Top diseases and bio functions from Ingenuity® Pathway Analysis (IPA) of the RNA-seq data with a threshold of P < 0.05, showing the most significant molecular and cellular functions dysregulated in the placenta by maternal obesity, sorted by P value.

