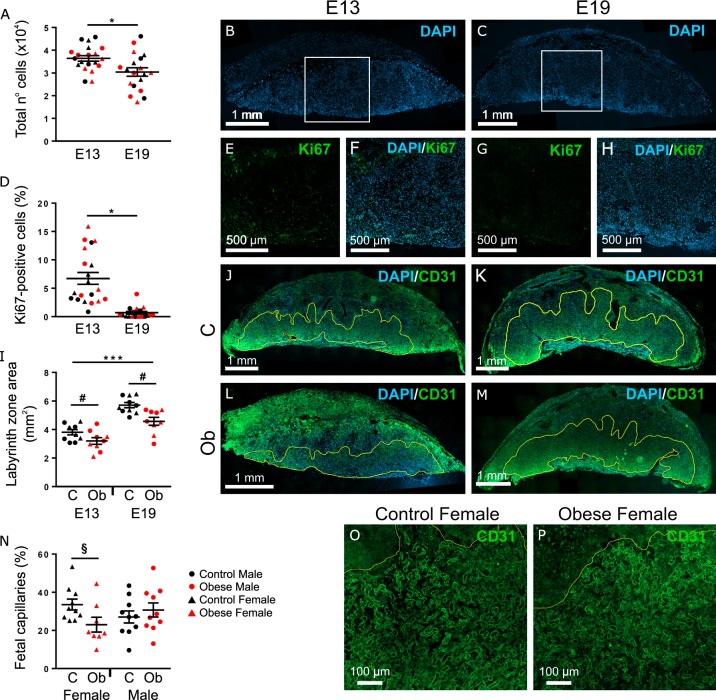
Fig. 4. Immunofluorescent staining of targets related to the top three molecular and cellular functions shown in IPA.
All analyses were conducted in both male and female placentae of mothers fed either regular chow (C, Control group) or obesogenic diet (Ob, Obese group), at E13 and E19. a–c The total number of cells in the placenta decreased between E13 (n = 20) and E19 (n = 19). d–h The proportion of Ki67-positive cells across the whole placenta decreased between E13 (n = 20) and E19 (n = 19). i–m The size of the labyrinth zone increased between E13 and E19, and was reduced in response to maternal obesity (C n = 10, Ob n = 9, at each time point). n–p The proportion of fetal capillaries within the labyrinth zone was decreased by maternal obesogenic diet in females (C n = 10, Ob n = 9). a, d, i, n Results are shown as mean ± SEM. Gestational age differences are denoted by *P < 0.05, **P < 0.001, or ***P < 0.0001, and maternal obesity effect is indicated by #P < 0.001, according to three-way ANOVA. §Denotes maternal obesity effect (P < 0.05), determined by two-way ANOVA analysis of E13 and E19 female placentae only.

