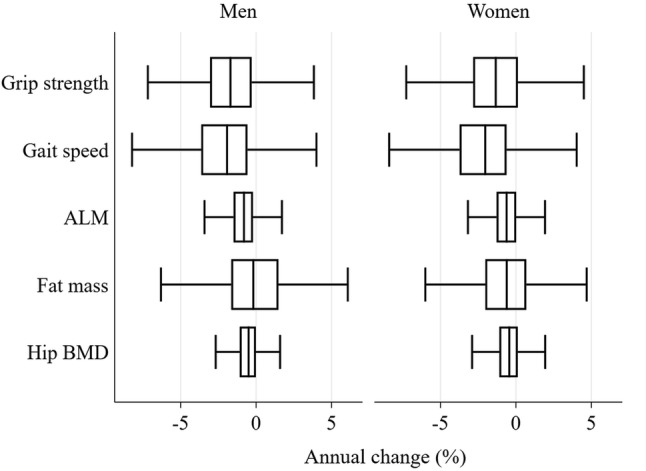
Fig. 1.

Estimated annual percentage change in characteristics among men and women. Median annual changes (%): grip strength − 1.5, gait speed − 2.0; ALM − 0.7; fat mass − 0.4; hip BMD − 0.5. ALM appendicular lean mass, BMD bone mineral density. The three vertical lines in the box represent the lower quartile (Q1), median and upper quartile (Q3). The lower whisker is the smallest value that is greater than Q1 − 1.5 × IQR and the upper quartile is the largest value which is less than Q3 + 1.5 × IQR, where IQR = Q3–Q1. Estimates of percentage change for each participant were derived using person-specific linear regression models for percentage change since baseline calculated at each time-point as the outcome with age at each time-point as the only predictor. Annual percentage change is given by the regression coefficient for age. Analysis was restricted to 1418 men and 1499 women with data on at least one change measure
