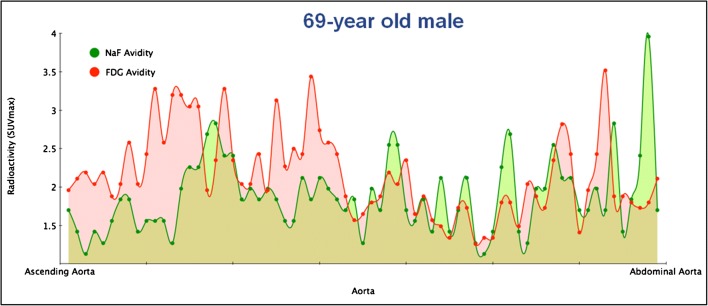
Fig. 6.
NaF uptake is often not confined to identifiable lesions, but varies through each arterial segment. Variation in FDG (red areas) and NaF (green areas) uptake through the entire aorta. The red and green dots are blood background subtracted SUVmax values from horizontal slices of 3.75 mm thickness. Note the outspoken disconcordance and the generally higher FDG uptake in the thoracic part (to the left) and generally higher NaF uptake in the abdominal part of the aorta (to the right) (from the material of reference 23)

