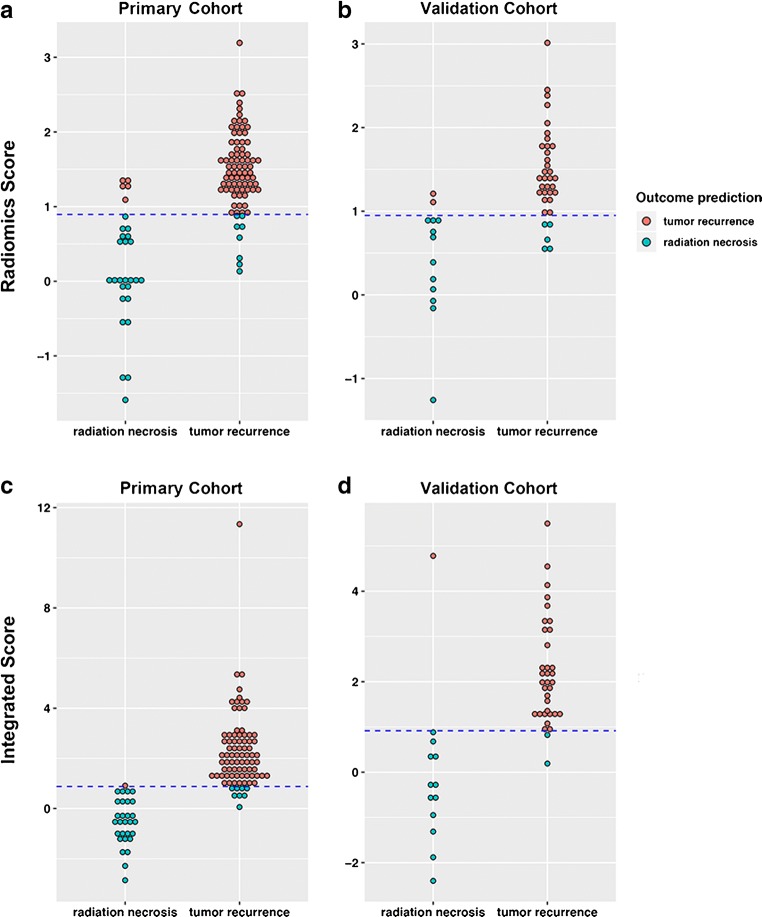
Fig. 5.
Diagnostic performance for the model based on only radiomics signature derived from 18F-FDG, 11C-MET, and MRI. Radiomics score for the primary (a) and validation (b) cohorts. Integrated score for the primary (c) and validation (d) cohorts. The diagrams show the differentiation ability of each model in terms of the agreement between the predicted risk and observed outcomes of tumor recurrence. The dotted line represents the threshold for tumor recurrence diagnosis: 0.895 and 0.905 for the radiomics score and integrated score, respectively

