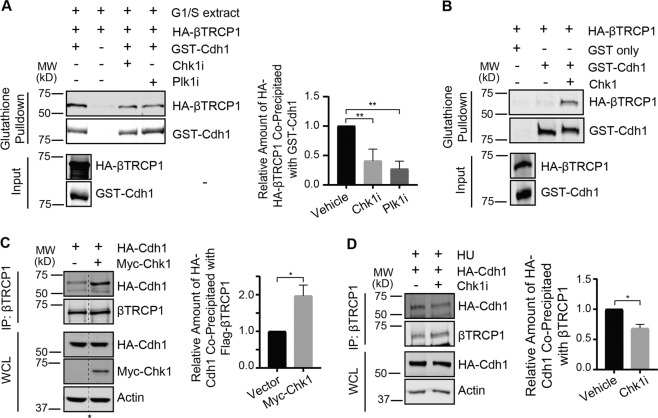
Fig. 2. SCFβTRCP1 negatively regulates Cdh1 at the G1-S boundary in a Chk1-dependent manner.
a, b Chk1 impacts on interaction between βTRCP1 and Cdh1 both in G1-S extracts and in vitro. a HeLa cells were treated with HU (2 mM) for 20 h to arrest them at the G1-S boundary and extracts were prepared. The G1-S extracts were treated with Chk1 inhibitor, CHIR-124 (500 nM) where indicated before incubating with GST-Cdh1. After phosphorylation, GST-Cdh1 was first bound by glutathione beads and then mixed with in vitro translated HA-βTRCP1 for an hour. Immunoblot analysis was carried out to detect the bound HA-βTRCP1 protein. Right panel, quantification of the band intensities. Co-precipiated HA-βTRCP1 band intensities were normalized to the respective GST-Cdh1 bands and then further normalized to vehicle control (-). Data are represented as mean ± SD, **p < 0.005 by ANOVA with Holm-Sidak post-test, n = 3. b Immunoblots showing that the in vitro phosphorylation of GST-Cdh1 by Chk1 promotes its binding with HA-βTRCP1. c, d Chk1 activity is crucial for the interaction of Cdh1 with βTRCP1 in vivo. c Immunoblot analysis of immunoprecipitates and whole-cell lysates derived from 293T cells transfected with HA-Cdh1 and Myc-Chk1 (where indicated). 30 h post-transfection, cells were treated with proteasome inhibitor MG132 (10 µM) for 5 h and then harvested to do immunoprecipitation to detect the interaction between HA-Cdh1 and endogenous βTRCP1 proteins. Right panel, quantification of the band intensities (n = 3). Immunoprecipiated HA-Cdh1 band intensities were normalized to the respective βTRCP1 IP bands and then further normalized to Vector control (-). The dashed line and asterisk represents the removal of an intervening lane btween these two samples. d Immunoblot analysis of immunoprecipitates and whole-cell lysates derived from 293T cells transfected with both HA-Cdh1. 30 h post-transfection, Cells were treated with hydroxyurea (HU), Chk1 inhibitor (where indicated), and the proteasome inhibitor MG132 (10 µM) for 5 h before harvesting to do IPs. Right panel, quantification of the band intensities (n = 3). Immunoprecipiated HA-Cdh1 band intensities were normalized to the respective βTRCP1 IP bands and then further normalized to Vehicle-treated control (-). Data are presented as mean and SEM. Significance in panel (a) was determined with a one-way ANOVA and significance in panels (c) and (d) was determined by a one-tailed unpaired T-test (*p < 0.05 and **p < 0.005).

