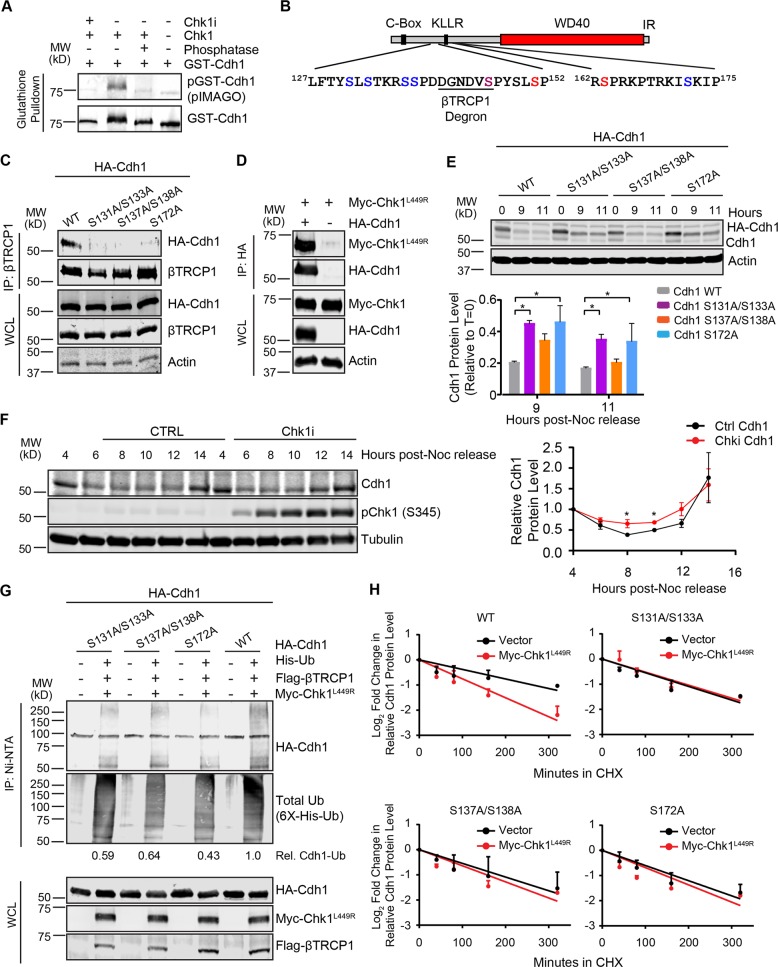
Fig. 3. Phosphorylation of Cdh1 by Chk1 creates a phosphodegron recognized by SCFβTRCP1.
a Chk1 phosphorylates Cdh1 in vitro. GST-Cdh1 was phosphorylated with Chk1 through in vitro kinase assays. Immunoblot represents immunoprecipitated GST-Cdh1 on glutathione beads following in vitro kinase assays. PIMAGO western blot kit was used to detect phospho-GST-Cdh1. Phosphorylation was further confirmed by including Chk1 inhibitor (Chk1i) where indicated during the kinase assays or by treating phosphorylated GST-Cdh1 with phosphatase. b Schematic diagram of Cdh1. Chk1-mediated phosphorylation sites identified from mass-spectrometry analysis are indicated in blue. Cdh1 phosphorylation sites mediated by Cyclin A-Cdk2 and Plk1 are in red and magenta, respectively. The SCF-βTRCP1 phosphodegron is indicated. c Chk1-mediated phosphorylation of Cdh1 creates a binding site for βTRCP1. 293T cells were transfected with the indicated HA-Cdh1 constructs. Cells were treated with the proteasome inhibitor MG132 (10 µM) for 5 h and the interaction between HA-Cdh1 and endogenous βTRCP1 was analyzed. d Cdh1 interacts with Chk1 in vivo. Both HA-Cdh1 and constitutively active Myc-Chk1L449R were co-expressed in 293T cells. 30 h post-transfection, cells were treated with the proteasome inhibitor MG132 (10 µM) for 5 h. The interaction between HA-Cdh1 and Myc-Chk1L449R proteins was monitored by immunoprecipitation. e Chk1-mediated phosphorylation regulates Cdh1 protein levels at the G1/S transistion. HeLa cells were transfected with the indicated doxycycline-inducible HA-Cdh1 constructs and synchronized at G1/S by double thymidine block (DTB). Doxycycline was added during the final 4 h of the DTB. Cells were released into nocodazole and mitotic cells were collected and relased into fresh media. Whole-cell lysates were prepared for immunoblot analysis at the indicated time points. The intensities of Cdh1 bands were normalized to actin, then normalized to the the level of the Cdh1 protein at t = 0 h. The plot represents the relative fraction of indicated Cdh1 remaining at the indicated time points. Data are represented as mean ± SEM, *p < 0.05 by ANOVA with Holm-Sidak post-test, n = 3. f Inhibition of endogenous Chk1 by Chk1 inhibitor, CHIR-124 (500 nM) affects Cdh1 level at the G1/S boundary. Hela cells were synchronized in mitosis with a thymidine-nocodazole block. 4 h after release from nocodazole into the cell cycle, cells were treated with Chk1 inhibitor, CHIR-124 (500 nM) where indicated and collected at specific time point for immunoblot analysis. The plot represents relative Cdh1 protein level where the Cdh1 bands were normalized to tubulin, then normalized to the t = 4 h time point. Data are represented as mean ± SD, *p < 0.05 by one-tailed unpaired t-test, n = 3. g, h Chk1 promotes ubiquitinatin by SCFβTRCP1 and destabilizes Cdh1. g In vivo ubiquitination assays shows that SCFβTRCP1 promotes Cdh1 ubiquitination in a Chk1-dependent manner. 293T cells were transfected with the constructs encoding HA-Cdh1 or HA-Cdh1 mutants, His-ubiquitin, Flag- βTRCP1 and Myc-Chk1L449R as indicated. After a treatment with MG132 for 5 h, the lysates were collected and incubate with Ni-NTA agarose. His-ubiquitinated proteins were eluted, resolved by SDS-PAGE and immunoblotted with the indicated antibodies. The relative abuncance of HA signal in the Ni-pull down normalized to the His-Ub signal is indicated. See also Fig. S3c (h) Mutations of Chk1-mediated phosphorylation sites in Cdh1 increases the stability of Cdh1. 293T cells were transfected with the indicated HA-Cdh1 constructs together with Flag-βTRCP1 and Myc-Chk1L449R (where indicated). Cells were treated with 50 µg/ml cycloheximide (CHX). At the indicated time points, whole-cell lysates were prepared for immunoblot analysis. The intensities of Cdh1 bands were normalized to actin, then normalized to the t = 0 time point. The plots represent the relative fraction of indicated Cdh1 protein at indicated time point after adding CHX. Data are represented as mean ± SD, n = 3 biological replicates. See also Fig. S3d.

