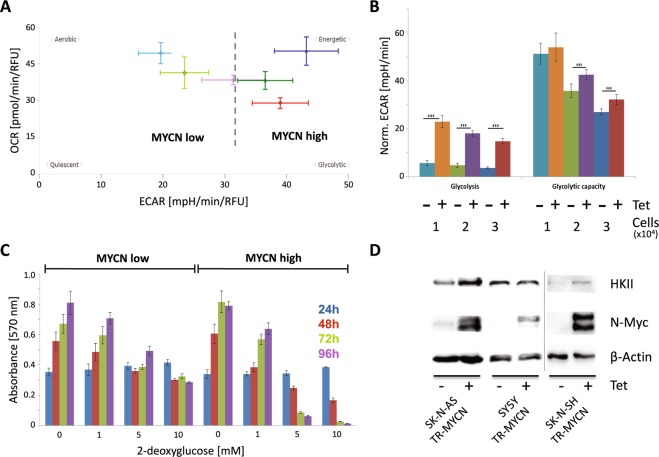
Figure 2.
(A) Comparison of aerobic respiration and glycolysis indicated by the oxygen consumption rate (OCR) and extracellular acidification rate (ECAR) in SHEP-TR-MYCN cells with (“MYCN high”) and without induction of N-Myc (“MYCN low”). Colors indicate different glucose (Gluc) levels and N-Myc expression during cultivation and measurement; “MYCN low” cells are depicted in pink (1 g Gluc/l), light green (2 g Gluc/l) and light blue (4.5 g Gluc/l), while “MYCN high” cells are given in red (1 g Gluc/l), dark green (2 g Gluc/l) and dark blue (4.5 g Gluc/l). (B) Glycolysis and glycolytic capacity were monitored by measuring ECAR upon addition of external glucose and oligomycin in SHEP-TR-MYCN cells with and without induction of MYCN by tetracycline using cell numbers as indicated (“Norm. ECAR”: extracellular acidification rate normalized to 10,000 cells). The color code indicates different cell numbers and MYCN status, as 104, 2 × 10⁴ or 3 × 10⁴ cells were used in the assay with and without induction of MYCN by tetracycline (“Tet”). Data were generated in triplicates in two independent experiments. Asterisks indicate a significance level p < 0.001. (C) SHEP-TR-MYCN cells were cultivated in the absence (“MYCN low”) or presence of tetracycline (“MYCN high”) and incubated with 2-deoxyglucose. At time points indicated, cell viability was recorded. Color code identifies samples analyzed at 24 h in blue, at 48 hours in red, at 72 hours in green and at 96 hours in purple. Data were generated in triplicates in two independent experiments. (D) Hexokinase II (HKII) and N-Myc protein expression in SK-N-AS TR-MYCN, SY5Y TR-MYCN and SK-N-SH TR-MYCN cells. “+” and “−“ refer to addition of tetracycline (Tet), which is regulating MYCN expression levels. The information presented here is derived from two experiments as indicated by the separating vertical line.

