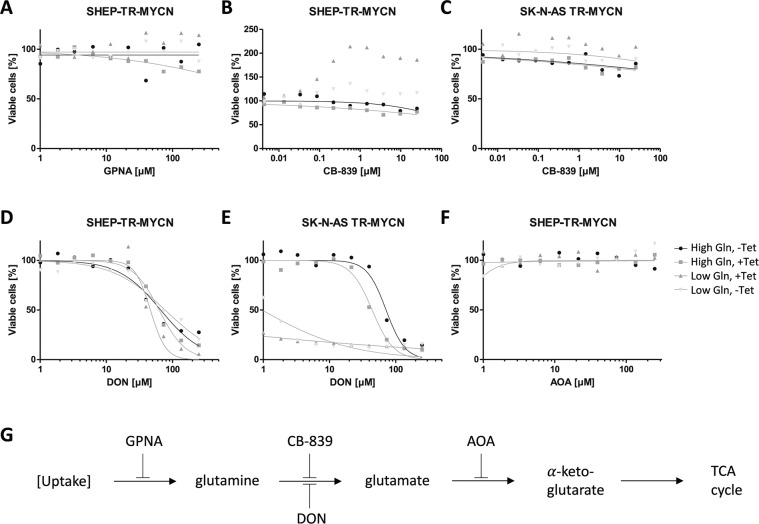
Figure 3.
(A–F) Cell viability depending on small-molecule inhibitors of glutamine metabolism in cell lines indicated. Grey triangles indicate cells incubated in the presence of low Gln with high (dark grey) or low (light grey) N-Myc levels; rectangles and circles depict cells cultivated in the presence of high Gln with high (rectangles) or low levels (circles) of N-Myc. In experimental conditions indicated, high MYCN expression was induced by addition of tetracycline (“+ Tet”). (G) Scheme depicting the biochemical steps, in which the small molecule inhibitors of glutamine metabolism are supposed to act (AOA: aminoxyacetate; DON: 6-diazo-5-oxo-L-norleucine).

