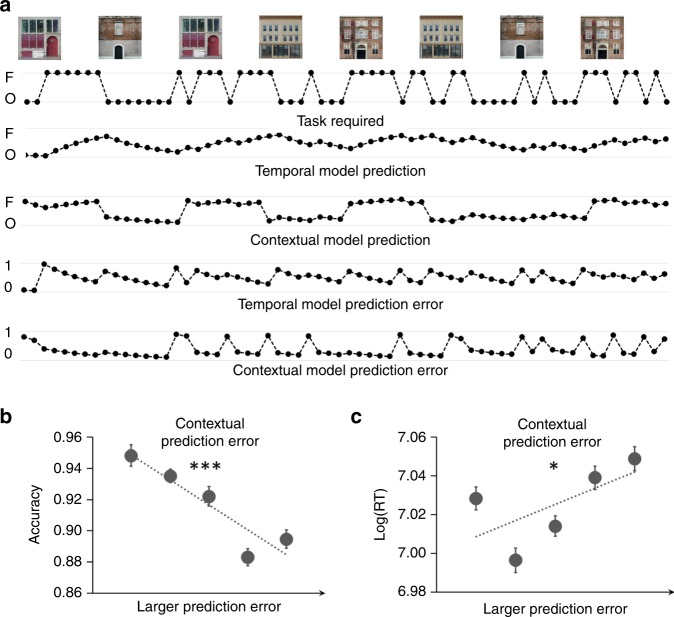
Fig. 3. Behavioral analyses and results.
a Time courses of reinforcement learning model outputs for an example run. The building images mark the beginning of blocks. Each dot represents one trial. Note that contextual model predictions are more sensitive to change of contexts than temporal model predictions. b, c Quintiles (x-axis) and mean ± SEM of group-level accuracy (b) and logged RT (c), plotted as a function of contextual model prediction error. *p < 0.05, ***p < 0.001 (two sided one-sample t-tests). The experiment was conducted once (n = 33 biologically independent samples). P values are uncorrected. Source data are provided as a Source Data file.

