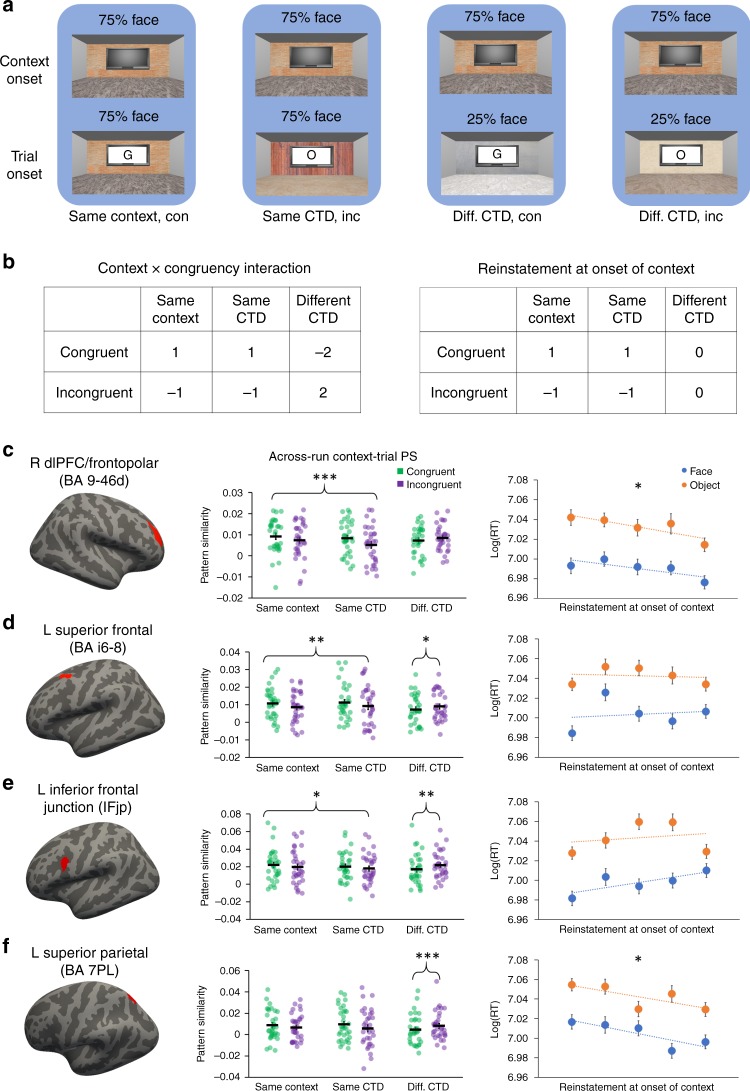
Fig. 4. Frontoparietal reinstatement of CTD.
a Four examples (grouped by blue background) of how the CTD of context A (top row) and the required task and the CTD of a trial in context B (bottom row) define the experimental condition for testing the reinstatement of CTD (text label below the background). b Left: linear contrast testing the reinstatement of CTD. To account for different frequencies of trial types and to make the contrast orthogonal to main effects, the weight for Different CTD conditions was twice the weight for Same Context and Same CTD conditions. Right: contrast used to test the modulation of CTD reinstatement on RT. c–f Frontoparietal ROIs showing significant reinstatement of CTD. From left to right: locations of ROI (marked in red), Individual data and mean ± SEM of context-trial pattern similarity plotted as a function of experimental conditions, quintiles (x-axis) of group mean of log-transformed RT (±SEM) plotted as a function of task type and context-trial pattern similarity. The names of the ROIs are from the Human Connectome Project’s multi-modal cortical parcellation32. *p < 0.05; **p < 0.01; ***p < 0.001 (two-sided one-sample t-tests). con, congruent; inc, incongruent. For bar graphs, see Table 1 for P values. The experiment was conducted once (n = 33 biologically independent samples). Source data are provided as a Source Data file.

