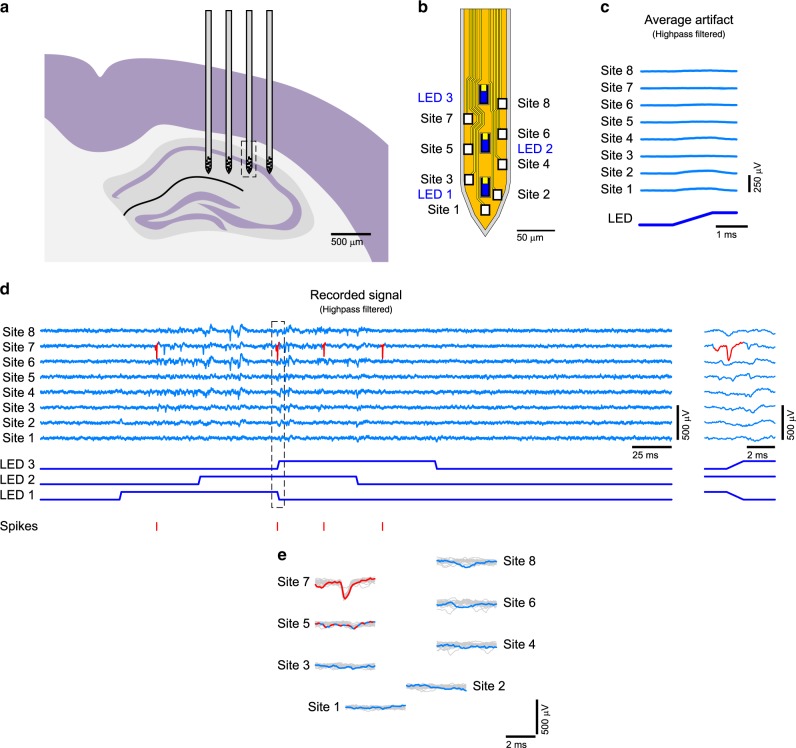
Fig. 6. Stimulation-artifact-free in vivo opto-electrophysiology.
a Schematic illustration of the location of implanted miniSTAR μLED optoelectrode inside the brain. The shank from which the data presented in parts c–h were collected is highlighted with a rectangle with dashed lines. b Schematic illustration of the tip of the miniSTAR optoelectrode. c Mean waveforms of stimulation artifact recorded on miniSTAR optoelectrodes, from channels that correspond to the electrodes on different locations on the tips. Shaded regions show one standard deviation away from the mean. LED drive signal with resulting LED surface irradiance of 3 mW mm–2 at the surface of the LED (radiant flux of 460 nW) was used. One LED was turned on and off at a time. d Traces of the recorded signals and the raster plots of sorted spikes. No signal processing, except for highpass filtering, was applied to the recorded signal. The inset on the right shows the magnified view of the region inside the rectangle with black dashed lines. e Magnified waveforms of the spikes recorded during the period highlighted in part d, overlaid on top of waveforms of 20 other spikes from the same neurons. Both spontaneous and light-induced spike waveforms are used without discrimination.

