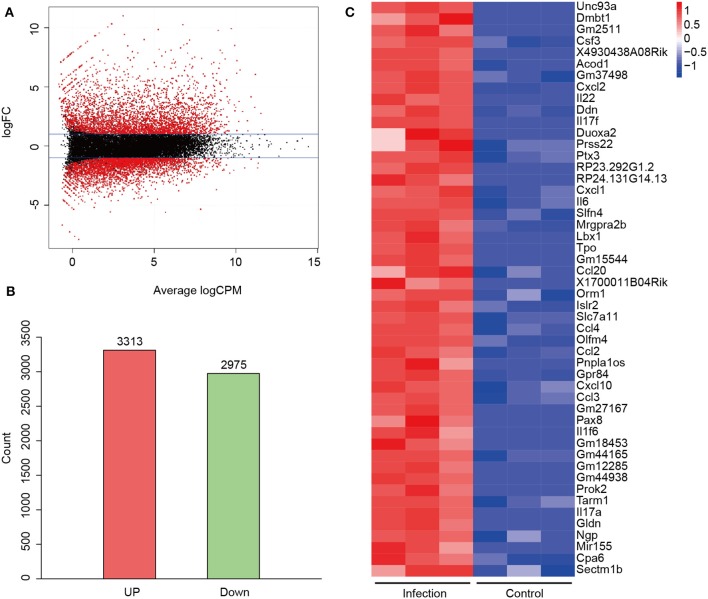
Figure 2.
Differentially expressed genes (DEGs) between A. baumannii-infected lungs and control lungs. (A) MA plot of DEGs. Red dots are DEGs in A. baumannii-infected lung with 2-fold change. The black dots reflect no change. (B) Gene counts of the upregulated and downregulated DEGs. (C) Heatmap of the top 50 upregulated genes sorted by high Log FC. Red means high expression of the genes.

