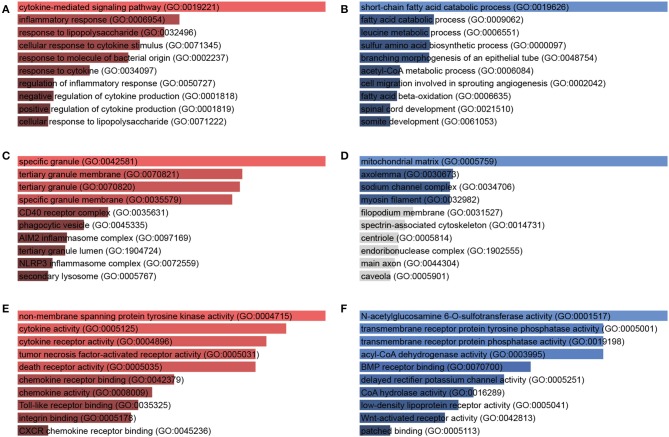
Figure 3.
Gene Ontology (GO) enrichment analysis of DEGs in response to A. baumannii lung infection. Biological process (A,B), cellular component (C,D), and molecular function (E,F) of upregulated (red) and downregulated (blue) DEGs between A. baumannii-infected lungs vs. control lungs. The bars are sorted by P-value ranking, the length of the bar represents the significance of that specific gene term, the brighter the color, the more significant that term is.

