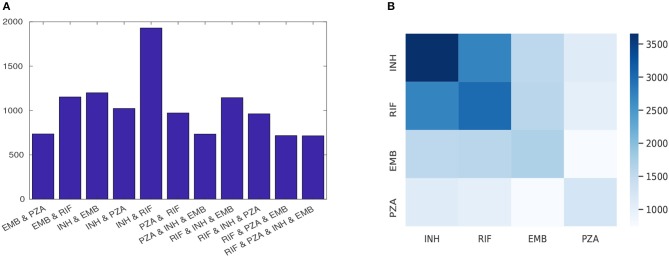
Figure 1.
The phenotypic profile of first-line drugs; (A) each row shows the number of isolates that are resistant to at least the indicated drugs combination and (B) heatmap quantifying the number of instances of resistance co-occurrence between drugs. Off-diagonal elements show resistance co-occurrence between different drugs and diagonal elements show resistant to a single drug.

