Figure 7.
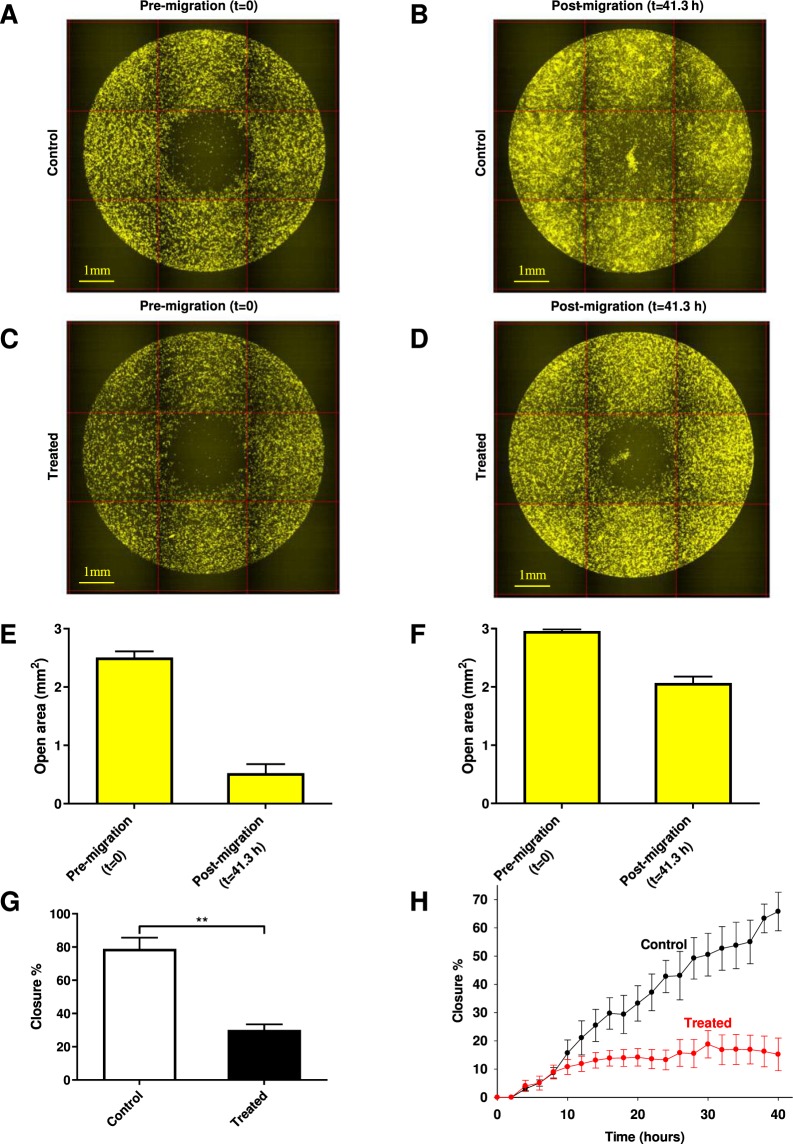
Representative images of the wound healing assay and the high content screening of closure responses using Oris Pro assay. Representative CM-Dil-20 stained images of cMSCs are shown at t = 0 for non-treated (A) and ClGBI-treated (100 µM) wells (B). Images were taken immediately following cell seeding. The final images of the closure areas (t = 41.3 h) are in panel C (control) and D (treated) respectively. Intensities were rescaled, scale bar represent 1 mm. Diagrams present open area (cell free zone) of ClGBI-treated (100 µM, F) and non-treated (control; E) cMSCs at t = 0 and t = 41.3 hours. Each bar represents the average and SEM of 7 wells (n = 7). G, Comparison of closure responses of MSCs following treatment with ClGBI (100 µM) over 41.3 hours versus control non-treated MSCs. Closure% = [(initial cell free are − cell free are at a given time pont)/initial cell free area] * 100). ***p < 0.0001 where indicated versus non-treated control. H, Time-dependence of the closure responses of MSCs in the absence (Control, black) and presence of 100 µM ClGBI (Treated, red). Each time point represents the average percent closure and SEM of samples from 3 different placenta donors.

