Figure 3.
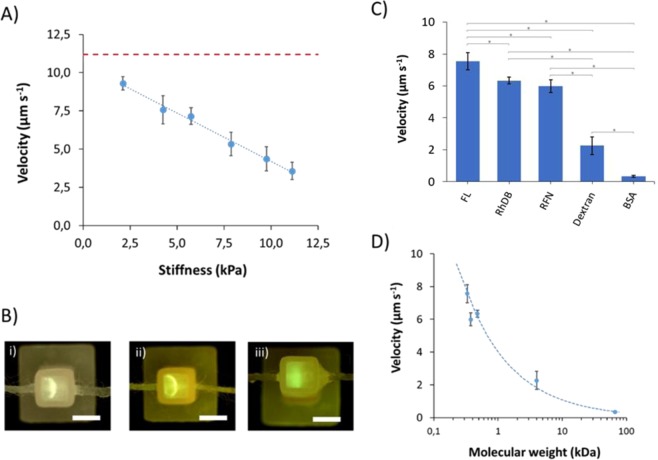
Delivery in soft tissue models based on GelMA hydrogels. In all cases 0.5 pg of compound was dropped on acrylic thread and 100 μA was applied for electric field (unless specified otherwise). 5 mM Tris/HEPES buffer was used for both inlet/outlet chambers and GelMA. Error bars are based on the standard deviation of 3 replicates. (A) Speed of fluorescein (FL, a model compound) as a function of the stiffness (Young’s modulus). Trend line was y = −0.63 × +10.52, R-squared = 0.9912. Red dashed line represents the velocity at 0 crosslinking (11.2 ± 0.4 μm/s). (B) Representative pictures were taken for (i) 5% GelMA (45 s cross-link, stiffness of 4.3 kPa) at 100 μA, (ii) 7.5% GelMA (30 s cross-link, 7.9 kPa) at 100 μA, and (iii) 7.5% GelMA (60 s cross-link, 11.1 kPa) at 150 μA. Scale bar is 2.5 mm (C) Velocity of 5 different compounds and bioactive species: fluorescein (FL), rhodamine B (RhDB), riboflavin (RFN), BSA, dextran) in a GelMA hydrogel with a stiffness of 4.3 kPa, conditions were the same as Fig. 1. *Indicates significant different (P < 0.05). (D) Velocity as a function of the molecular weight of the compound. Speed in hydrogel declines with molecular weight following a trend of y = 4.02 × −0.57, R-squared = 0.9879.

