

Visual Abstract

Key Words: 2-photon microscopy, deep vein thrombosis, imaging, pulmonary embolism, venous thromboembolism
Abbreviations and Acronyms: DVT, deep venous thrombosis; FITC, fluorescein isothiocyanate; IQR, interquartile range; IVC, inferior vena cava; PE, pulmonary embolism; ROS, reactive oxygen species; VTE, venous thromboembolism
Highlights
-
•
We established a novel clinically relevant murine DVT model at femoral/saphenous vein induced by flow restriction and light illumination.
-
•
Our model newly succeeded in inducing DVT in a valve pocket and enabled spontaneous pulmonary embolism of fibrin-rich thrombus from lower extremity vein, reproducing the clinical VTE scenario.
-
•
This model is suitable for motion-free in vivo high-resolution imaging of fibrin-rich DVT development and organization using 2-photon microscopy, enabling the real-time imaging of migration of platelets and leukocytes into the erythrocyte-rich DVT.
Summary
This work established a new murine venous thromboembolism (VTE) model. This model has multiple novel features representing clinical VTE that include the following: 1) deep venous thrombosis (DVT) was formed and extended in the long axis of femoral/saphenous vein; 2) thrombus was formed in a venous valve pocket; 3) deligation of suture-induced spontaneous pulmonary emboli of fibrin-rich DVT; and 4) cardiac motion-free femoral/saphenous vein allowed high-resolution intravital microscopic imaging of fibrin-rich DVT. This new model requires only commercially available epifluorescence microscopy. Therefore, this model has significant potential for better understanding of VTE pathophysiology.
Venous thromboembolism (VTE), including the following 2 sequential clinical situations, deep venous thrombosis (DVT) and pulmonary embolism (PE), is responsible for a significant number of cardiovascular deaths (1).
Studies have shown that leukocytes and platelets play a major role in the pathogenesis of DVT (2, 3, 4). Recent advances in molecular imaging techniques allowed visualization of dynamic behavior of inflammatory cells at a single-cell level in living organs; however, the dynamic movement of inflammatory cells in fibrin-rich DVT has not been visualized due to the lack of appropriate animal models suitable for in vivo imaging. There are several issues associated with the already established murine DVT models that they are inappropriate for in vivo imaging and unable to mimic clinical VTE features including spontaneous PE from lower extremity vein and common site of DVT (valvular pocket) (5,6).
Ligature-based inferior vena cava (IVC) models, which include stasis and stenosis models, are most commonly used and have clinical features of DVT (2,7); however, these models are not suitable for in vivo imaging owing to their location in the body and their large thrombus size for microscopic imaging. Also, they are incapable of spontaneous embolization due to complete ligation. Models used in past in vivo thrombus imaging studies were mainly ferric chloride (8, 9, 10) or laser-induced thrombus (11, 12, 13), which form non-DVT-like platelet-rich thrombus.
In a previous study, we succeeded in designing a venous ligation DVT model in the jugular vein, allowing us to monitor inflamed activity of DVT in the same animal using fluorodeoxyglucose–positron emission tomography (14). However, owing to its large thrombus size and pulsatile artifact, high-resolution in vivo imaging at a single-cell level using intravital fluorescence microscopy was not feasible in jugular DVT.
Establishment of novel VTE imaging model is critical to overcome these issues. In this study, we established a novel murine VTE model, which is suitable for real-time in vivo imaging of thrombus formation in the large lower extremity veins using intravital fluorescence microscopy and is capable of inducing spontaneous PE.
Methods
Detailed methodology for all protocols, antibodies, labeling agents, and imaging systems used in this study are provided in the Supplemental Methods.
Surgical ligation of the femoral vein
The anesthetized mice were immobilized on a plastic board in a dorsal position. Simple skin incisions permitted vessel exposures of femoral/saphenous vein and artery. The femoral vein at the proximal site of venous bifurcation was separated carefully from the femoral artery, and surgically ligated with 7-0 nylon sutures to induce complete vessel occlusion as shown in Figure 1A, resulting in significant decrease of venous flow at saphenous vein (median: 2.27 [interquartile range (IQR): 1.86 to 2.59] vs. 0.35 [IQR: 0.20 to 0.61] mm/s; p < 0.001). Unlike the IVC, venous flow was restored even after the complete ligation at femoral vein (Figure 1B) through the backflow into the side branch (Figure 1C). All mice with bleedings of the femoral vein during surgery were excluded from further experiments.
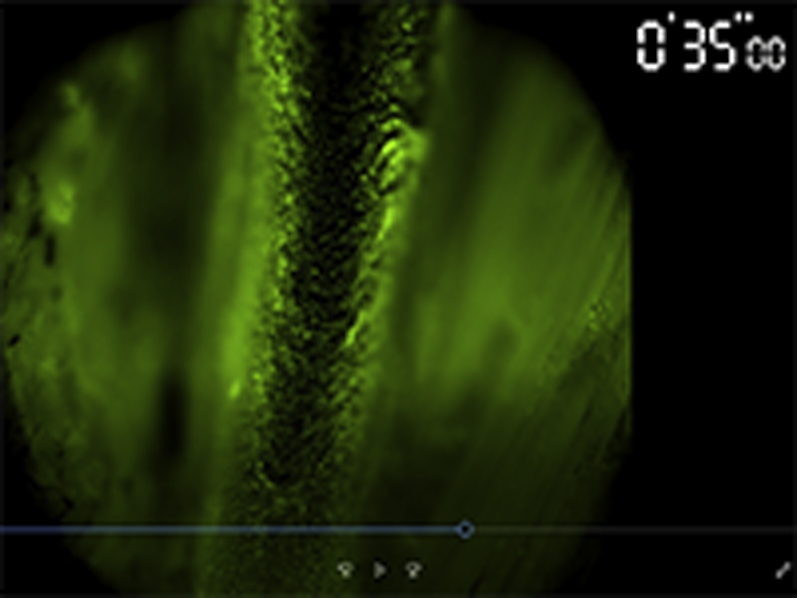
Time-lapse imaging of thrombus formation.
Time-lapse imaging of thrombus formation at saphenous vein induced by light irradiation of epifluorescence microscopy. Blood flow was visualized by injection of FITC-dextran.
Figure 1.

Induction of Stasis- and Irradiation-Induced DVT in the Murine Femoral/Saphenous Vein
(A) Surgical ligation of the femoral vein induced flow restriction. Dotted white line indicates the femoral vein. Bars = 5 mm. (B) Venous flow velocity at the saphenous vein in ligated mice showed significant decrease compared with in nonligated mice (median: 2.27 [interquartile range (IQR): 1.86 to 2.59] vs. 0.35 [IQR: 0.20 to 0.61] mm/s; p < 0.001; n = 8 to 16 per group). ***p < 0.001. Box-and-whisker plot: middle line represents median value, box indicates IQR (25th, 75th percentiles), and range bars show maximum and minimum. (C) Even after ligation of the femoral vein (V), venous flow in the saphenous vein persisted at a low level as flow diverted (white arrows) into its side branches. Bars = 500 μm. (D) Imaging of real-time thrombus formation (visualized as a filling defect [*] in fluorescein isothiocyanate [FITC]-dextran–based venography) in the flow-restricted saphenous vein following the light irradiation through excitation filter in FITC channel (475/35 nm). Thrombus formation was initiated from the downstream of blood flow within seconds after the irradiation and extended distally in the long-axis direction of the vessel. See also Video 1. Without ligation, thrombus was not formed during the observation. Bars = 500 μm. (C,D) White arrows indicate venous flow direction. Prox = proximal.
Statistical analysis
All statistical analyses were performed using GraphPad Prism 7 software (La Jolla, California). Results were expressed as median with IQR (25th, 75th percentiles). The statistical significance of differences between 2 groups were assessed using Mann-Whitney U test. Differences between more than 2 groups were evaluated using Kruskal-Wallis test followed by the Dunn multiple comparison post hoc test. A p value of <0.05 was considered statistically significant.
Results
Visualization of real-time thrombus formation at ligated femoral/saphenous vein by fluorescence microscopy
We initially tried to establish the stasis DVT model at the saphenous vein to allow in vivo imaging with fluorescence microscopy. However, due to multiple side branches and collateral formation within days, we failed to induce thrombus formation by ligation alone. We then tried to monitor the behavior of leukocytes and platelets after the ligation as they are reported to attach to the vein wall within several hours after the IVC ligation (2). Surprisingly, we could reproducibly observe real-time thrombus formation within minutes without any treatment with chemical agent for thrombus induction (Figure 1D, Video 1), indicating that observation by fluorescence microscopy triggered thrombus formation at ligated femoral/saphenous vein. We also confirmed thrombus was formed in both female C57BL/6J mice and ICR mice (a strain of albino mice) in the same manner (n = 5, respectively), indicating thrombus induction was sex-, strain-, and melamine-independent (data not shown).
We hypothesized that thrombus formation in this model requires both flow restriction and light irradiation by excitation light from fluorescence microscopy.
Thrombus formation in this model requires flow restriction and light irradiation by filtered excitation light
We assessed the relationship between venous flow velocity and thrombus area. We measured thrombus area in nonligated, partially ligated (to achieve middle range of flow velocity), and totally ligated femoral vein after exposure of fluorescein isothiocyanate (FITC)-channel filtered light (475/35 nm) for 60 s. The results showed that reduction of blood flow increased thrombus area and formation rate (Supplemental Figure 1A). Without ligation to reduce blood flow, thrombus never formed during the observation for several minutes (Figure 1D, bottom).
Next, to clarify the required conditions of light irradiation of thrombus formation in this model, we assessed the light intensity, light exposure time, and wavelength of excitation light in the thrombus formation. Higher light intensity and longer light exposure time induced larger thrombus area, indicating that thrombus formation is light flux irradiation-dependent (Supplemental Figures 1B and 1C). We generally use the FITC filter to observe thrombus as a negative area of FITC dextran; however, other wavelengths such as 350/50 nm (4′,6-diamidino-2-phenylindole channel) and 542/20 nm (tetramethyl rhodamine iso-thiocyanate channel) could also induce thrombus formation, suggesting that wavelength of irradiation light did not affect thrombus formation (Supplemental Figure 1D). To rule out the effect of fluorescence reaction between FITC-filtered excitation light and FITC dextran, we confirmed that thrombus could be induced with other blood flow imaging dyes including Evans blue dye (Wako Pure Chemical Industries, Osaka, Japan) and Tracer-653 probe (Molecular Targeting Technologies, Inc., West Chester, Pennsylvania) (Supplemental Figure 1E). We also tested FITC-filtered light exposure without FITC dextran. Although real-time thrombus formation was not visualized, injection of FITC dextran after light irradiation showed thrombus as a negative contrast, indicating that FITC dextran and fluorescence reaction are not necessary as a trigger of thrombus formation (data not shown).
Formed thrombus in our new DVT model has common features with clinical DVT
Notably, formed thrombus in our model exhibited multiple common features with human DVT in morphology, histology, and common sites. Unlike the conventional thrombus imaging models such as ferric chloride and rose bengal models, formed thrombus in our model showed a large mass of elliptical shape that extended and elongated in a long-axis direction of the vessel without occlusion, similar to clinical DVT (5). Both ferric chloride and rose bengal models exhibited a small dot pattern that mainly consisted of platelets and few erythrocytes, similar to arterial thrombosis (Figure 2A). Although excitation light-irradiation alone without ligation failed DVT formation within minutes, longer (>10 min) continuous light illumination resulted in platelet-rich thrombus, similar to a previous laser-induced thrombus model (Figure 2A, bottom).

Real-time imaging of thrombus formation using FITC-labeled RBC.
RBCs were ex vivo labeled with FITC, followed by injection to mice via jugular vein. Circulating RBCs were directly attached to venous wall during thrombus initiation.

Real-time imaging of the moment of thromboembolism shortly after DVT formation.
Movie of the initiation of thromboembolism using FITC-dextran was shown. The edge of DVT formed at lower extremity vein was separated and embolized.
Figure 2.

Formed Thrombus in Our New DVT Model Has Common Features With Clinical DVT
(A) Thrombus positive for glycophorin A (red blood cell [RBC] marker) with low accumulation of rhodamine 6G indicates the erythrocyte- and fibrin-rich DVT. Both ferric chloride and rose bengal models induced dotlike platelet (Plt)-rich thrombus, indicating arterial thrombus. Continuous (>10 min) excitation light irradiation without ligation induced platelet-rich thrombus, similar to a previous laser-induced thrombus model (bottom). Real-time imaging of thrombus formation using FITC-labeled RBC is shown in Video 2. (B) Fibrin-rich thrombus with few platelets was observed in our new model. (C) Phlebotomy-induced anemic mice exhibited decreased thrombus size (median: 0.31 [IQR: 0.22, 0.48] vs. 0.19 [IQR: 0.14, 0.31] mm2; p = 0.017, n = 10 to 12 per group). (D) Macroscopic image of thrombus represented red-white thrombus, similar to clinical DVT. In vivo fluorescence imaging of same thrombus precisely visualized the localization of platelet-rich white thrombus lesion as rhodamine 6G–positive area. (E) Pathological analyses of formed thrombus in our model confirmed the erythrocyte- and fibrin-rich thrombus with infiltrating leukocytes, mimicking clinical DVT. DVT was formed at clinically relevant sites, specifically with (F) venous valve pocket and (G) venous confluences, indicating the similarity of rheological effects in human DVT. (H) DVT in our model enabled spontaneous embolization, allowing real-time visualization at the moment of thromboembolism (Video 3). Arrowheads indicate the broken site of DVT. Dotted circle indicates emboli. (I) Thrombus resolution was augmented by unfractionated heparin (median initial thrombus area: 53.8% [IQR: 29.4%, 69.7%] vs. 26.6% [IQR: 0%, 48.0%]; p = 0.047; n = 10 per group). Bars = 200 μm. *p < 0.05. White arrows indicate venous flow direction. Dex = dextran; FM = fluorescence microscopy; HE = hematoxylin and eosin; WBC = white blood cells; RBC = red blood cells; other abbreviations as in Figure 1.
It is well recognized that a clinical DVT mainly consists of erythrocytes and fibrin network with less platelet aggregation. Thrombus in our model allowed in vivo multicolor imaging to visualize thrombus components such as, for example, fibrin, erythrocytes, and platelets. Mice were injected with FITC dextran, rhodamine 6G (platelets and leukocytes) and human fibrinogen or anti-glycophorin A antibody (erythrocytes) before light irradiation. The multicolor imaging revealed the fibrin- and erythrocyte-rich thrombus with low accumulation of platelets and leukocytes (Figure 2B), recapitulating clinical DVT components. Real-time imaging of thrombus formation using FITC-labeled red blood cells also supports the formation of erythrocyte-rich thrombus (Video 2). Anemic mice induced by phlebotomy exhibited a significant decrease in thrombus size (median: 0.31 [IQR: 0.22, 0.48] vs. 0.19 [IQR: 0.14, 0.31] mm2; p = 0.017) (Figure 2C), indicating a significant role of erythrocytes in this DVT model. In vivo photomicrograph of thrombus represented red-white thrombus, similar to clinical DVT. Intravital microscopy of the same thrombus precisely visualized the localization of platelet-rich white thrombus lesion as a rhodamine 6G–positive area (Figure 2D). Pathological analyses of formed thrombus in our model confirmed erythrocyte- and fibrin-rich thrombus with infiltrating leukocytes, similar to clinical DVT (5) (Figure 2E).
Furthermore, our DVT model could reproduce several features of clinical DVT for the first time. DVT was formed at a frequent site, such as the venous valve pocket and venous confluences, indicating the similarity of rheological effects in human DVT (15,16) (Figures 2F and 2G). Additionally, DVT in our model enabled spontaneous embolization, allowing real-time visualization during thromboembolism (Figure 2H, Video 3). Lastly, this model enabled monitoring of pharmacological effects of antithrombotic drugs. Similar to clinical DVT, thrombus development in our model was prevented by pre-injection of unfractionated heparin (Figure 2I).
Spontaneous DVT embolization to pulmonary artery, as a novel PE model
Because the current DVT model allows spontaneous detachment of lower-extremity DVT, we tested whether this model can generate acute PE. After DVT formation in the femoral vein, we deligated the suture to allow embolization of thrombi. Alexa Fluor 647 conjugated fibrinogen (fibrinogen-AF647) was pre-injected to visualize thrombi. A large fibrin-rich DVT was visualized by in vivo fluorescence microscopy (Figure 3A). Although DVT was not embolized just after the deligation, most of the femoral DVT had disappeared within 30 min after the deligation, indicating that thrombi had spontaneously embolized to the pulmonary artery. Resected lungs exhibited strong fibrinogen-AF647–based fluorescence (Figure 3B, top). Images of the resected lungs from fibrinogen-AF647–injected mice without DVT were also taken to exclude the postmortem clot formation at pulmonary artery, and these mice showed no evidence of fluorescence signal (Figure 3B, bottom). To confirm that fluorescence signal is produced by embolized thrombus, histological assessment was performed. Hematoxylin and eosin staining of resected lungs showed fibrin-rich thrombus with inflammatory cells in the pulmonary artery. Carstairs staining showed that fibrinogen-AF647–positive structures imaged by fluorescence microscopy are fibrin-rich thrombus (Figure 3C). These data indicate that our DVT model can be used as a novel PE model.
Figure 3.

Spontaneous DVT Embolization to Pulmonary Artery, as a Novel PE Model
(A) Femoral vein was ligated and illuminated by excitation light to induce large thrombus size. DVT was visualized by pre-injection of fibrinogen-AF647 (red, left panel). Thirty min after the deligation of the femoral vein suture, the formed DVT had disappeared, indicating embolization (right panel). Bar = 500 μm. Dotted line indicates femoral vein. X indicates ligation site. (B) To confirm the femoral DVT embolized to the lungs, resected lungs were imaged using in vivo imaging system fluorescence reflectance imaging. Spotted fluorescence signal indicated embolized fibrin-rich DVT. Fibrinogen-AF647–injected mice without DVT exhibited no apparent fluorescent signal, suggesting fibrin-rich signal was not a postmortem clot. Bars = 2 mm. (C) HE staining of resected lung showed inflammatory cells infiltrated thrombus in the pulmonary artery. Right panel shows magnified image of dotted area in the left panel. Subsets of lung tissues were processed for frozen sections to visualize in vivo–injected fibrinogen-AF647 by fluorescence microscopy, confirming fluorescence signal (arrows) was fibrin-rich embolized DVT from lower extremity. Bars = 200 μm. auto = auto-fluorescence; fibrinogen-AF647 = fibrinogen, Alexa Fluor 647 Conjugate; other abbreviations as in Figures 1 and 2.
Platelet-, neutrophil-, and oxidative stress–independent thrombus formation
A recent study demonstrated the significant role of platelets and neutrophils in the initiation of DVT formation in the IVC-ligature model (2). To elucidate the role of these cells in the DVT formation in our model, we imaged leukocytes and platelets during DVT formation. Multicolor real-time imaging of DVT formation revealed that rhodamine 6G–labeled leukocytes and platelets did not clearly accumulate and attach to the vein wall prior to DVT formation, unlike the IVC-ligature model (Figure 4A). We then imaged and compared the DVT formation in the platelet- and neutrophil-depleted mice by pre-treatment with an antiplatelet antibody and antineutrophil antibody, which dramatically decreased circulating platelet and neutrophil counts (Supplemental Table 1). Both platelet- and neutrophil-depletion did not prevent thrombus formation and did not change thrombus size acutely (p = NS, respectively) (Figures 4B and 4C). Neutrophil extracellular traps are also reported as a key player of DVT initiation (2,17); however, pre-treatment with deoxyribonuclease also did not affect the DVT size in our model (Figure 4D). As oxidative stress is considered as a major contributor to the formation of DVT in models such as the laser-induced thrombus model and the rose bengal model, we then assessed the role of oxidative stress in our model. To visualize reactive oxygen species (ROS) during DVT formation, 3′-(p-aminophenyl) fluorescein was administered before DVT initiation. However, ROS signal was not shown in thrombus area in our model, whereas laser/ROS model using hematoporphyrin (12) showed ROS-positive platelet thrombus (Figure 4E). In addition, an antioxidant and ROS scavenger, N-acetylcysteine failed to block DVT formation in our model, indicating the mechanism of DVT formation in our model is ROS-independent (Figure 4F). These results collectively suggest that DVT formation in our model is platelet-, neutrophil-, and ROS-independent, unlike previous animal thrombosis models.
Figure 4.

Platelet-, Neutrophil-, and Oxidative Stress–Independent Thrombus Formation
(A) Time-lapse multicolor real-time imaging of DVT formation revealed that rhodamine 6G–labeled leukocytes and platelets did not clearly accumulate and attach to the venous wall prior to DVT formation (arrows). Leukocytes and platelets (rhodamine 6G) accumulated after 30 s of irradiation, whereas DVT formed within 15 s. Bars = 200 μm. Delayed platelet accumulation was confirmed using antiplatelet antibody (right panel). Neither platelet-depletion (B) nor neutrophil-depletion (C) prevented thrombus formation nor changed thrombus size (median: 0.42 [IQR: 0.21 to 0.62] vs. 0.38 [IQR: 0.26 to 0.61]; p = NS; n = 10 per group for platelet depletion; and median: 0.34 [IQR: 0.26, 0.45] vs. 0.34 [IQR: 0.26, 0.55]; p = not significant [NS]; n = 6 per group for neutrophil depletion, respectively). (D) Pre-treatment with deoxyribonuclease also did not affect the DVT formation in our model, indicating neutrophil extracellular traps–independent thrombus initiation in this model (median: 0.39 [IQR: 0.30, 0.60] vs. 0.45 [IQR: 0.33, 0.61]; p = NS; n = 5 per group). (E) Reactive oxygen species (ROS) did not localize within the thrombus area in our model (upper panel), whereas laser/ROS model using hematoporphyrin (lower panel) showed ROS-positive (arrowheads) platelet-rich thrombus. Bars = 500 μm. (F) The antioxidant and ROS scavenger, N-acetylcysteine failed to block DVT formation in our model, indicating a ROS-independent mechanism of DVT formation (median: 0.36 [IQR: 0.26, 0.54] vs. 0.33 [IQR: 0.26, 0.48]; p = NS; n = 6 per group). DNAse = deoxyribonuclease; NAC = N-acetylcysteine; other Abbreviations as in Figure 1.
Two-photon imaging of formed DVT
Recent advances in the 2-photon microscopy enabled fluorescence imaging of living deeper tissue such as, for example, brain, skin, bone, and heart (12,18,19). To the best of our knowledge, this is the first model visualizing erythrocyte-rich DVT in murine femoral vein with a single-cell level resolution. High-resolution imaging with 2-photon microscopy allows for a clear distinction between rhodamine 6G–labeled leukocytes and platelets by size (Figures 5A and 5B). Second harmonic generation can visualize collagen fibers; therefore, the vein wall and venous valve can be imaged without an exogenous labeling agent. DVT formed within venous valve pocket and surrounding platelets accumulation can be clearly imaged (Figures 5C to 5E).
Figure 5.

Multiphoton Imaging of Formed DVT and Venous Valve Pocket
(A) Representative image of DVT formed at saphenous vein. The vessel wall can be visualized by second harmonic generation (blue) without the need for exogenous labeling agents. (B) Magnified image of dotted linefromA is shown. Rhodamine 6G–labeled leukocyte and platelets can be distinguished by their size. (C) Venous valve leaflets were also visualized by second harmonic generation (blue, arrows). Sagittal image (D) and 3-dimensional image (E) confirmed that DVT formed within the valvular pocket sinus, which is the common DVT site in clinical situation. Bars = 50 μm. Abbreviations as in Figures 1 and 2.
Dynamics of platelets and leukocytes in DVT organization process
Serial imaging of DVT by epifluorescence microscopy easily allows visualization of dynamics of rhodamine 6G–positive area in whole thrombus; however, distinction between platelets and leukocytes is not possible because of insufficient resolution (Figure 6A). High-resolution 4-dimensional imaging by multiphoton microscopy enables clear discrimination of and visualizes dynamics of both leukocytes and platelets during the thrombus organization process (Figure 6B). Although recent studies suggest the role of platelets in the initiation of DVT (2), the comprehensive role and dynamics of platelets in the DVT developing and organization process are unknown. Whole thrombus imaging with multiphoton microscopy showed that platelet accumulation within DVT is proximal side–dominant, and resolution is distal side–dominant (Supplemental Figure 2A). We newly observed the platelets’ accumulation and deposition on the surface of the DVT, resulting in changing the rheology of blood flow and showing multiple layers of platelet-rich and erythrocyte-rich layers (Figure 6C). This might explain why DVT exhibits an annual ringlike structure. We also observed the leukocytes migrating into the DVT accompanied with platelets. As neutrophil-platelet interaction is recently reported as facilitators of inflammation (20,21), the accumulation of platelets on the formed DVT might play a role in the initiation of inflammation process, which is not a hemostatic role. Leukocyte migration can also be imaged and analyzed via ImageJ (National Institutes of Health, Bethesda, Maryland) (Figures 6D and 6E, Video 4). Tracking of rhodamine 6G–positive leukocytes shows directional migration of leukocytes toward the center of DVT, suggesting that leukocytes are actively recruited to DVT (Figure 6E). Those migrating leukocytes were confirmed as mainly Ly-6G–positive neutrophils (Supplemental Figure 2B), which has been reported in past histological analyses (14).

Time-lapse imaging of leukocyte migration into fibrin-rich DVT.
Time-lapse imaging of leukocytes (red, rhodamine 6G) migration into fibrin-rich DVT (green, Fibrinogen-AF488). White lines indicate the migrating leukocytes path.
Figure 6.

Spatiotemporal Dynamics of Inflammatory Cells and Platelets in the DVT Organization
(A) Serial imaging of DVT by epifluorescence allows visualization of rhodamine 6G–positive cells (leukocytes and platelets) infiltrating into DVT; however, discrimination between leukocytes and platelets is not possible due to low resolution. Bars = 100 μm. (B) Multiphoton imaging of DVT enabled clear visualization of spatiotemporal dynamics of leukocytes and platelets. Top left square shows magnified images from dotted line.Bars = 100 μm. (C) Zones of platelets aggregate in the circulating blood near the DVT (arrows), followed by platelets depositing at the edge of erythrocyte-rich DVT. The deposition of the platelets changed the rheology, resulting in the formation of multiples of platelet layers and erythrocyte layers (dotted line). Bar = 10 μm. (D) Blood-based leukocytes migrate into the DVT accompanied by platelets (Video 4). Lower panels show dynamics of leukocytes and platelets in dotted area in upper panel.Bars = 10 μm. (E) Tracked paths of migrating leukocytes over 30 min. White circle indicates tracking leukocytes, and white line shows tracked path (Video 4). Lower panel shows the moving direction in x-axis of each initial x-position. Positive value indicates leukocytes moved toward the right direction, and negative indicates left direction. Leukocytes are moving toward the center of DVT, indicating leukocytes are being recruited into the DVT, rather than random migration occurring. Bar = 10 μm. Abbreviations as in Figures 1 and 2.
Discussion
Coagulation factors and platelet activation have been thought to be key elements of venous thrombosis until recent discoveries using a murine DVT model, which showed that activation of immune responses strongly influence blood coagulation and pathological thrombus formation (2,22). Although murine ligature-based models at IVC are widely used, an opposite scenario is seen in clinical DVT. Clinical DVT forms mainly in flow-maintained veins, followed by flow restriction after initial thrombus development, whereas ligature-based models induced flow-restriction first. The other limitation of the IVC-based model is the lack of venous valve. Venous valve pockets and venous confluence in the lower extremity veins are reported as frequent sites of DVT initiation (15,16,23).
Recent studies reported in vivo thrombosis imaging systems available for high-resolution microscopic imaging (2,11,12,24). However, these thrombus models are injury-induced (laser-induced or electrolytic) platelet thrombus–based, not a fibrin- and erythrocyte-rich thrombus, which is visualized in our study. Furthermore, most of these models use small vessels such as cremaster muscle and mesentery vessels. These microvascular thrombosis models are related with pathological thrombus that occurs during sepsis and other inflammatory disorders, but that is not relevant to large vessels such as jugular and femoral vein, as observed in human VTE (25).
In terms of thrombus induction on the stage of microscopy, our model is similar with the conventional laser-induced in vivo imaging models (11, 12, 13,26); however, we succeeded in thrombus induction in femoral/saphenous vein, where is literally a deep vein, as opposed to cremaster and mesenteric arterioles in the previous laser-induced model. Second, we used filtered white light (mainly through FITC filter in the microscope) produced from a mercury lamp, not a nitrogen or helium-neon laser as used in past studies (11, 12, 13,26). We believe that weaker light stimulation and larger vein size are the reasons that thrombus could not be formed by light irradiation alone and that the formed thrombus was not a platelet-rich thrombus.
A recent study succeeded in applying the IVC stenosis model for in vivo imaging using 2-photon microscopy (2). The study elegantly showed the recruitment of leukocytes and platelets at venous vessel wall as an initiation of DVT. However, formed DVT was too large to visualize the immune cell recruitment from circulating blood flow by intravital fluorescence microscopy. Therefore, visualization of immune cell behavior after DVT formation has been technically limited. To the best of our knowledge, our model, for the first time, enabled visualization of real-time imaging of erythrocyte-rich thrombus formation and organization process in vivo.
Furthermore, our model enabled us to visualize the initiation of thromboembolism and induce pulmonary embolization after DVT formation. PE is a common and fatal complication of DVT. Repeated PE triggers the pulmonary hypertension, which is known as chronic thromboembolic pulmonary hypertension. Although there are murine models of PE in the past, the pathophysiology is quite different from the clinical PE. Systemic administration of coagulation factors such as thrombin (27) and thromboplastin (28) and exogenous clot injection (29) are commonly used to induce PE, but the occurrence of pulmonary thrombus is not clearly related and embolized from pre-existed DVT in the lower extremity. The photochemical injury model using rose bengal (30) and the ferric chloride model (31) could induce PE after DVT formation in large vessels, but the main components of thrombus are platelets. Therefore, to the best of our knowledge, this is the first clinically relevant PE model as a consequence of erythrocyte- and fibrin-rich DVT formed in the femoral/saphenous vein, which is the common source of clinical PE. Because our model allows repeated small DVT induction and embolization, our PE model has the potential to be a novel chronic thromboembolic pulmonary hypertension model and further evaluation is desired.
Study limitations
The intravascular infusion of rhodamine 6G labels both platelets and leukocytes; thus, these cells cannot be discriminated using lower resolution epifluorescence microscopy. Also, in the 2-photon imaging study, the use of the large vessels limits imaging area to the upper surface of the vein (100- to 200-μm depth). Thus, we could not perform a full 3-dimensional thrombus volume measurement. Third, wavelength of infrared laser in our 2-photon microscopy system is limited: from 700 to 1080 nm. Using other systems with wider wavelength (700 to 1,300 nm) or with single-photon imaging laser, 3 or more multicolor imaging could be performed and would expand our study. Lastly, the precise mechanism of thrombus formation in our model is still unclear. Thus, we cannot yet confirm whether this model is useful to investigate the mechanisms of human DVT initiation.
Conclusions
Our newly established DVT model enables real-time in vivo imaging of erythrocyte-rich DVT formation and organization process in the murine femoral vein. The formed DVT in this model reproduces several common features of clinical DVT. We propose the utility of our model for better understanding of the pathophysiology of clinical DVT using the high-resolution visualization of the DVT organization process such as the dynamic recruitment of platelets and leukocytes to erythrocyte-rich thrombus.
Perspectives.
COMPETENCY IN MEDICAL KNOWLEDGE: There are several animal models of thrombosis. However, all of the models have advantages and disadvantages. For instance, the ferric chloride model does not need complicated surgical techniques and is applicable for in vivo microscopic imaging. However, it induces platelet-rich thrombus, thereby the ferric chloride model is not appropriate for DVT experimental study. The IVC-ligature model is currently the most used fibrin- and erythrocyte-rich DVT model. However, its location and large thrombus size are inappropriate for in vivo microscopic imaging and inducing pulmonary emboli.
TRANSLATIONAL OUTLOOK: Thromboembolic events mostly occur only once throughout the 70 to 90 years of human life, and it only takes several seconds from the initiation of thrombus detachment to complete embolization. Therefore, understanding and visualizing such a quick event has been technically challenging even in animal models. Here, we newly succeeded in inducing and visualizing thrombus formation in vivo, and furthermore, we visualized the moment of thromboembolic event. Our model has significant potential for better understanding of VTE pathophysiology.
Acknowledgments
The authors would like to thank Koichiro Haruwaka, Yoshihisa Tachibana, and Hiroaki Wake for providing technical support in 2-photon microscopy imaging.
Footnotes
This study was supported by Grants-In-Aid for Scientific Research from the Ministry of Education, Culture, Sports, Science and Technology of Japan (19K08516), the Mochida Memorial Foundation for Medical and Pharmaceutical Research, and National Institutes of Health’s National Heart, Lung, and Blood Institute grant R01HL137913. Drs. Toh and Irino have reported that the Division of Evidence-based Laboratory Medicine was established by an endowment fund from the Sysmex Corporation. Dr. Jaffer has received research grants from Canon and Siemens; has served as a proctor for and on the Advisory Boards of Abbott Vascular and Boston Scientific; has consulted for Acrostak; and is a shareholder in Intravascular Imaging, Inc. All other authors have reported that they have no relationships relevant to the contents of this paper to disclose.
The authors attest they are in compliance with human studies committees and animal welfare regulations of the authors’ institutions and Food and Drug Administration guidelines, including patient consent where appropriate. For more information, visit the JACC: Basic to Translational Scienceauthor instructions page.
Appendix
For an expanded Methods section, and supplemental figures, a table, and videos, please see the online version of this paper.
Appendix
References
- 1.Jaff M.R., McMurtry M.S., Archer S.L. Management of massive and submassive pulmonary embolism, iliofemoral deep vein thrombosis, and chronic thromboembolic pulmonary hypertension: a scientific statement from the American Heart Association. Circulation. 2011;123:1788–1830. doi: 10.1161/CIR.0b013e318214914f. [DOI] [PubMed] [Google Scholar]
- 2.von Bruhl M.L., Stark K., Steinhart A. Monocytes, neutrophils, and platelets cooperate to initiate and propagate venous thrombosis in mice in vivo. J Exp Med. 2012;209:819–835. doi: 10.1084/jem.20112322. [DOI] [PMC free article] [PubMed] [Google Scholar]
- 3.Wakefield T.W., Myers D.D., Henke P.K. Mechanisms of venous thrombosis and resolution. Arterioscler Thromb Vasc Biol. 2008;28:387–391. doi: 10.1161/ATVBAHA.108.162289. [DOI] [PubMed] [Google Scholar]
- 4.Saha P., Humphries J., Modarai B. Leukocytes and the natural history of deep vein thrombosis: current concepts and future directions. Arterioscler Thromb Vasc Biol. 2011;31:506–512. doi: 10.1161/ATVBAHA.110.213405. [DOI] [PMC free article] [PubMed] [Google Scholar]
- 5.Kearon C. Natural history of venous thromboembolism. Circulation. 2003;107:I22–I30. doi: 10.1161/01.CIR.0000078464.82671.78. [DOI] [PubMed] [Google Scholar]
- 6.Diaz J.A., Saha P., Cooley B. Choosing a mouse model of venous thrombosis. Arterioscler Thromb Vasc Biol. 2019;39:311–318. doi: 10.1161/ATVBAHA.118.311818. [DOI] [PubMed] [Google Scholar]
- 7.Diaz J.A., Farris D.M., Wrobleski S.K., Myers D.D., Wakefield T.W. Inferior vena cava branch variations in C57BL/6 mice have an impact on thrombus size in an IVC ligation (stasis) model. J Thromb Haemost. 2015;13:660–664. doi: 10.1111/jth.12866. [DOI] [PubMed] [Google Scholar]
- 8.Hara T., Bhayana B., Thompson B. Molecular imaging of fibrin deposition in deep vein thrombosis using fibrin-targeted near-infrared fluorescence. J Am Coll Cardiol Img. 2012;5:607–615. doi: 10.1016/j.jcmg.2012.01.017. [DOI] [PMC free article] [PubMed] [Google Scholar]
- 9.Ripplinger C.M., Kessinger C.W., Li C. Inflammation modulates murine venous thrombosis resolution in vivo: assessment by multimodal fluorescence molecular imaging. Arterioscler Thromb Vasc Biol. 2012;32:2616–2624. doi: 10.1161/ATVBAHA.112.251983. [DOI] [PMC free article] [PubMed] [Google Scholar]
- 10.Flaumenhaft R., Tanaka E., Graham G.J. Localization and quantification of platelet-rich thrombi in large blood vessels with near-infrared fluorescence imaging. Circulation. 2007;115:84–93. doi: 10.1161/CIRCULATIONAHA.106.643908. [DOI] [PMC free article] [PubMed] [Google Scholar]
- 11.Falati S., Gross P., Merrill-Skoloff G., Furie B.C., Furie B. Real-time in vivo imaging of platelets, tissue factor and fibrin during arterial thrombus formation in the mouse. Nat Med. 2002;8:1175–1181. doi: 10.1038/nm782. [DOI] [PubMed] [Google Scholar]
- 12.Nishimura S., Manabe I., Nagasaki M. In vivo imaging visualizes discoid platelet aggregations without endothelium disruption and implicates contribution of inflammatory cytokine and integrin signaling. Blood. 2012;119:e45–e56. doi: 10.1182/blood-2011-09-381400. [DOI] [PMC free article] [PubMed] [Google Scholar]
- 13.Kovács I.B., Tigyi-Sebes A., Trombitás K., Görög P. Evans blue: an ideal energy-absorbing material to produce intravascular microinjury by He-Ne gas laser. Microvasc Res. 1975;10:107–124. doi: 10.1016/0026-2862(75)90025-4. [DOI] [PubMed] [Google Scholar]
- 14.Hara T., Truelove J., Tawakol A. 18F-fluorodeoxyglucose positron emission tomography/computed tomography enables the detection of recurrent same-site deep vein thrombosis by illuminating recently formed, neutrophil-rich thrombus. Circulation. 2014;130:1044–1052. doi: 10.1161/CIRCULATIONAHA.114.008902. [DOI] [PMC free article] [PubMed] [Google Scholar]
- 15.Min S.K., Kim Y.H., Joh J.H. Diagnosis and treatment of lower extremity deep vein thrombosis: Korean practice guidelines. Vasc Specialist Int. 2016;32:77–104. doi: 10.5758/vsi.2016.32.3.77. [DOI] [PMC free article] [PubMed] [Google Scholar]
- 16.Hamer J.D., Malone P.C. Experimental deep venous thrombogenesis by a non-invasive method. Ann R Coll Surg Engl. 1984;66:416–419. [PMC free article] [PubMed] [Google Scholar]
- 17.Fuchs T.A., Brill A., Duerschmied D. Extracellular DNA traps promote thrombosis. Proc Natl Acad Sci U S A. 2010;107:15880–15885. doi: 10.1073/pnas.1005743107. [DOI] [PMC free article] [PubMed] [Google Scholar]
- 18.Rubart M. Two-photon microscopy of cells and tissue. Circ Res. 2004;95:1154–1166. doi: 10.1161/01.RES.0000150593.30324.42. [DOI] [PubMed] [Google Scholar]
- 19.Li W., Luehmann H.P., Hsiao H.M. Visualization of monocytic cells in regressing atherosclerotic plaques by intravital 2-photon and positron emission tomography-based imaging-brief report. Arterioscler Thromb Vasc Biol. 2018;38:1030–1036. doi: 10.1161/ATVBAHA.117.310517. [DOI] [PMC free article] [PubMed] [Google Scholar]
- 20.Lisman T. Platelet-neutrophil interactions as drivers of inflammatory and thrombotic disease. Cell Tissue Res. 2018;371:567–576. doi: 10.1007/s00441-017-2727-4. [DOI] [PMC free article] [PubMed] [Google Scholar]
- 21.Sreeramkumar V., Adrover J.M., Ballesteros I. Neutrophils scan for activated platelets to initiate inflammation. Science. 2014;346:1234–1238. doi: 10.1126/science.1256478. [DOI] [PMC free article] [PubMed] [Google Scholar]
- 22.Swystun L.L., Liaw P.C. The role of leukocytes in thrombosis. Blood. 2016;128:753–762. doi: 10.1182/blood-2016-05-718114. [DOI] [PubMed] [Google Scholar]
- 23.Sevitt S. The structure and growth of valve-pocket thrombi in femoral veins. J Clin Pathol. 1974;27:517–528. doi: 10.1136/jcp.27.7.517. [DOI] [PMC free article] [PubMed] [Google Scholar]
- 24.Cooley B.C. In vivo fluorescence imaging of large-vessel thrombosis in mice. Arterioscler Thromb Vasc Biol. 2011;31:1351–1356. doi: 10.1161/ATVBAHA.111.225334. [DOI] [PMC free article] [PubMed] [Google Scholar]
- 25.Fay W.P. Intravital fluorescence microscopy improves thrombosis phenotype scoring in mice. Arterioscler Thromb Vasc Biol. 2011;31:1253–1254. doi: 10.1161/ATVBAHA.111.226290. [DOI] [PubMed] [Google Scholar]
- 26.Erhardt J.A., Toomey J.R., Douglas S.A., Johns D.G. P2X1 stimulation promotes thrombin receptor-mediated platelet aggregation. J Thromb Haemost. 2006;4:882–890. doi: 10.1111/j.1538-7836.2006.01849.x. [DOI] [PubMed] [Google Scholar]
- 27.Kumada T., Dittman W.A., Majerus P.W. A role for thrombomodulin in the pathogenesis of thrombin-induced thromboembolism in mice. Blood. 1988;71:728–733. [PubMed] [Google Scholar]
- 28.Page M.J., Lourenco A.L., David T. Non-invasive imaging and cellular tracking of pulmonary emboli by near-infrared fluorescence and positron-emission tomography. Nat Commun. 2015;6:8448. doi: 10.1038/ncomms9448. [DOI] [PMC free article] [PubMed] [Google Scholar]
- 29.Singh S., Houng A., Reed G.L. Releasing the brakes on the fibrinolytic system in pulmonary emboli: unique effects of plasminogen activation and alpha2-antiplasmin inactivation. Circulation. 2017;135:1011–1020. doi: 10.1161/CIRCULATIONAHA.116.024421. [DOI] [PMC free article] [PubMed] [Google Scholar]
- 30.Matsuno H., Okada K., Ueshima S., Matsuo O., Kozawa O. α2-Antiplasmin plays a significant role in acute pulmonary embolism. J Thromb Haemost. 2003;1:1734–1739. doi: 10.1046/j.1538-7836.2003.00252.x. [DOI] [PubMed] [Google Scholar]
- 31.Shaya S.A., Gani D.M., Weitz J.I., Kim P.Y., Gross P.L. Factor XIII prevents pulmonary emboli in mice by stabilizing deep vein thrombi. Thromb Haemost. 2019;119:992–999. doi: 10.1055/s-0039-1685141. [DOI] [PubMed] [Google Scholar]
Associated Data
This section collects any data citations, data availability statements, or supplementary materials included in this article.