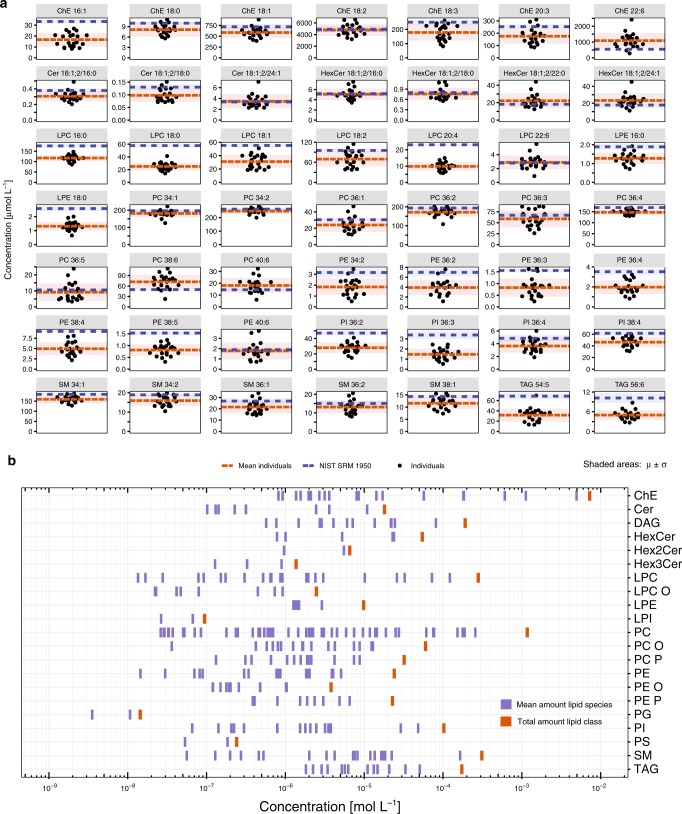
Fig. 6. Quantitative comparisons in the human plasma lipidome confirms LipidCreator output.
Lipid molecular species from major classes were quantified from the plasma samples of 21 healthy individuals (n = 21), and the NIST SRM 1950 reference material, by using transitions generated by LipidCreator. a Concentration differences of selected lipid species between healthy individuals (black dots) and average NIST 1950 plasma samples analyzed in this study (blue line). Each sample was measured with four independent technical replicates. 276 lipid species passed QC filters with a linear response R2 > 0.8 and CV < 20%. Shaded areas represent standard deviation around the mean of the individuals and the mean of the NIST 1950 plasma samples. b The plasma lipid species concentrations across 22 lipid classes are displayed as blue bars. The sum of the concentrations of individual lipid species of the lipid classes are indicated as vertical thick red bars (right). Source data are provided as a Source Data file.

