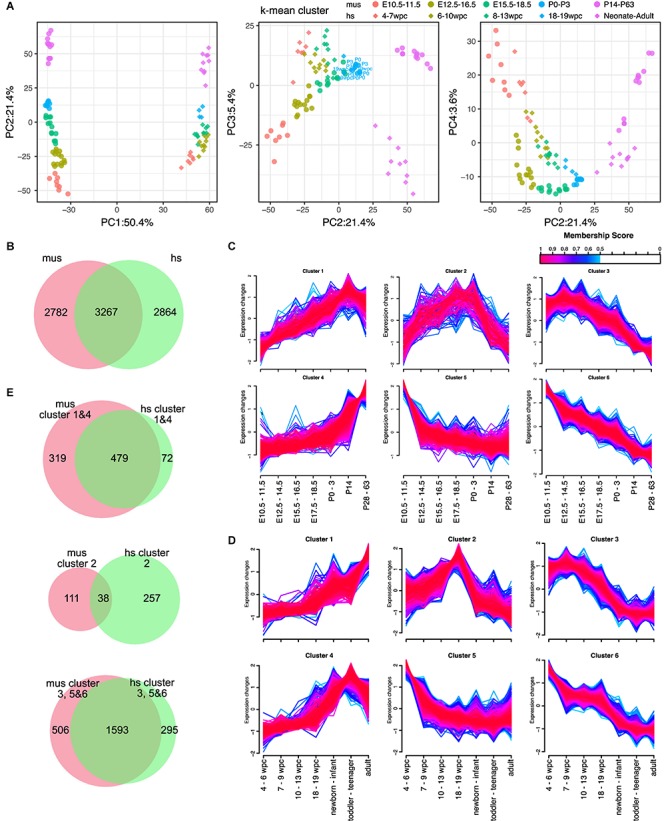
FIGURE 2.

Expression dynamics of DEGs during the maturation in hearts. (A) PCA of hearts from mouse and human. Shapes of dots represent species [diamond, human (hs); circle, mouse (mus)]. Color represents corresponding ages based on k-mean clusters as shown in figure. Ages shown in PCA plots indicate the ages of each point that is the closest dots between mouse and human. (B) Venn diagram of differentially expressed genes (DEGs) in mouse (mus) and human (hs). (C,D) Fuzzy clustering of DEGs in mouse (C) and human (D) with membership score of at least 0.5. Color indicates membership score of each gene in a cluster. (E) Venn diagrams of member genes in mouse and human. Gene clusters upregulated in adult (cluster 1 and 4), temporally upregulated (cluster 2), and downregulated in adult (cluster 3, 5, and 6) are shown.
