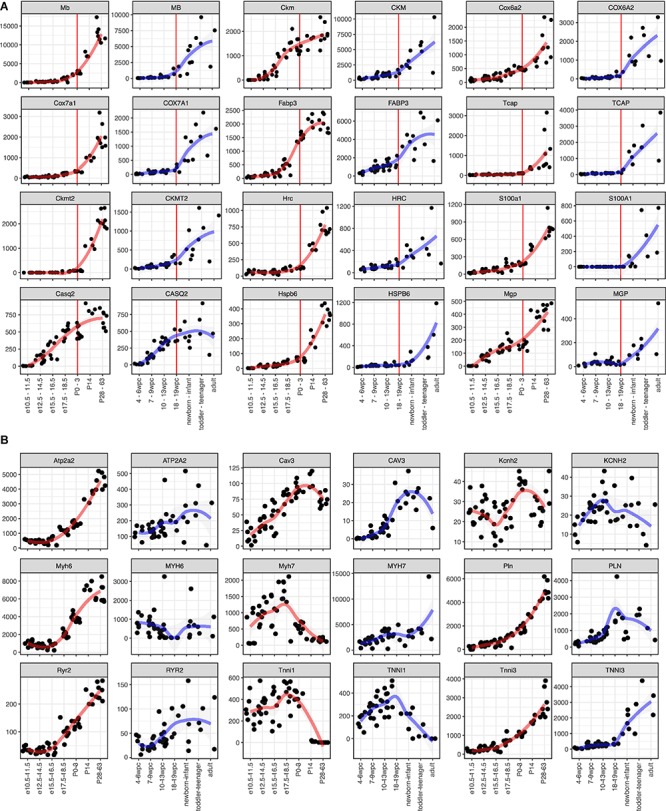
FIGURE 3.

Expression kinetics of the potential maturation marker genes. (A,B) Time course gene expression profiles. Mouse (left side) and human (right side) data is shown side-by-side. A red (for mouse) or blue (for human) line indicates local regression curve using locally estimated scatterplot smoothing (LOESS). (A) Candidate marker genes identified in this study. Red vertical lines indicate P0-3 in mouse and 18–19 wpc in human, which are considered as the same developmental stage. (B) Marker genes used in other literatures.
