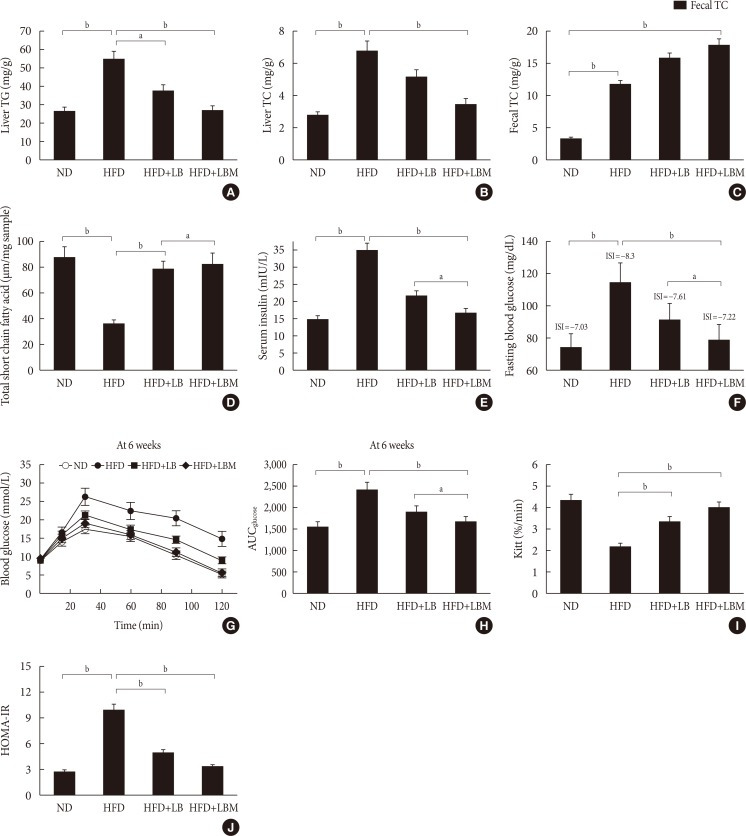
Fig. 2. Liver (A) total cholesterol (TC) and (B) triglyceride (TG) levels in mice with different treatments. (C) Fecal TC of the four groups at the end of feeding period, mice orally fed high-fat diet (HFD) supplemented with a mixture of L. plantarum-B. bifidum (1:2) and Salvia miltiorrhiza Bunge polysaccharide. (D) Total short-chain fatty acid concentration (the metabolized products of lipids) in cecal content. (E) Serum insulin; (F) fasting blood glucose (FBG). (G) Oral glucose tolerance test (OGTT) at 6 weeks after treatment and (H) the area under the curve (AUC) of OGTT at 6 weeks. (I) The glucose disappearance rate during the insulin tolerance test (KITT). (J) Homeostasis model assessment of insulin resistance (HOMA-IR). Insulin sensitivity index (ISI)=−ln (FPG×fasting insulin [FINS]). HOMA-IR=FINS (mIU/L)×FBG (mmol/L)/22.5. Data are expressed as the mean±standard deviation. ND, normal diet; LB, Lactobacillus plantarum X (LpX)-Bifidobacterium bifidum V (BbV); LBM, LpX-BbV+Salvia miltiorrhiza Bunge polysaccharide. aP<0.05, bP<0.01.

