FIG 3.
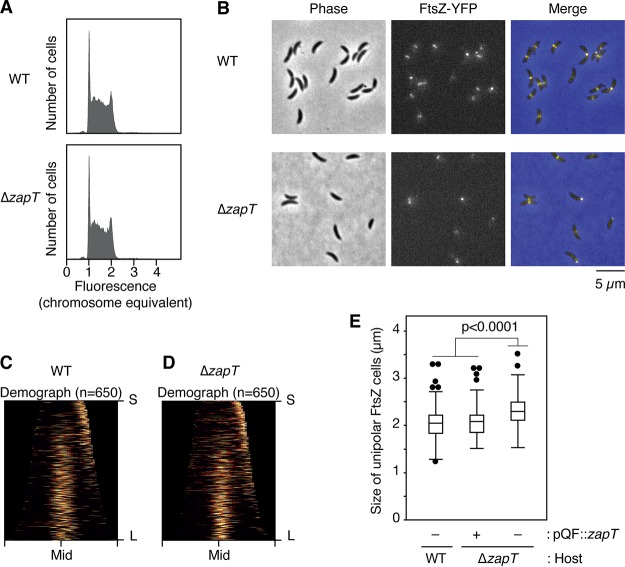
DNA content and FtsZ positioning in ΔzapT mutant cells. (A) The DNA contents of exponentially growing NA1000 (wild-type [WT]) and SHQ48 (ΔzapT) cells were analyzed using flow cytometry. For each strain, 50,000 cells were counted. (B to D) Localization of FtsZ-YFP in SHQ67 (wild-type [WT]) and SHQ136 (ΔzapT) cells grown exponentially in PYE medium. (B) After induction of FtsZ-YFP by treatment with 1 mM vanillate for 1 h, phase-contrast and fluorescent images were taken using fluorescence microscopy. (C and D) Demographs (C, WT; D, ΔzapT; n = 650 per strain) were generated as described in the legend for Fig. 1. For cells with a unipolar FtsZ-YFP focus, the FtsZ-marked cell pole was defined as a new pole. (E) Plasmid complementation test. Size distribution of cells with a unipolar FtsZ focus was analyzed for SHQ67 (WT) and SHQ136 (ΔzapT) strains harboring pQF::zapT or the empty vector pQF, and the results are shown as a box plot. The P value was calculated using the Mann-Whitney-Wilcoxon test.

