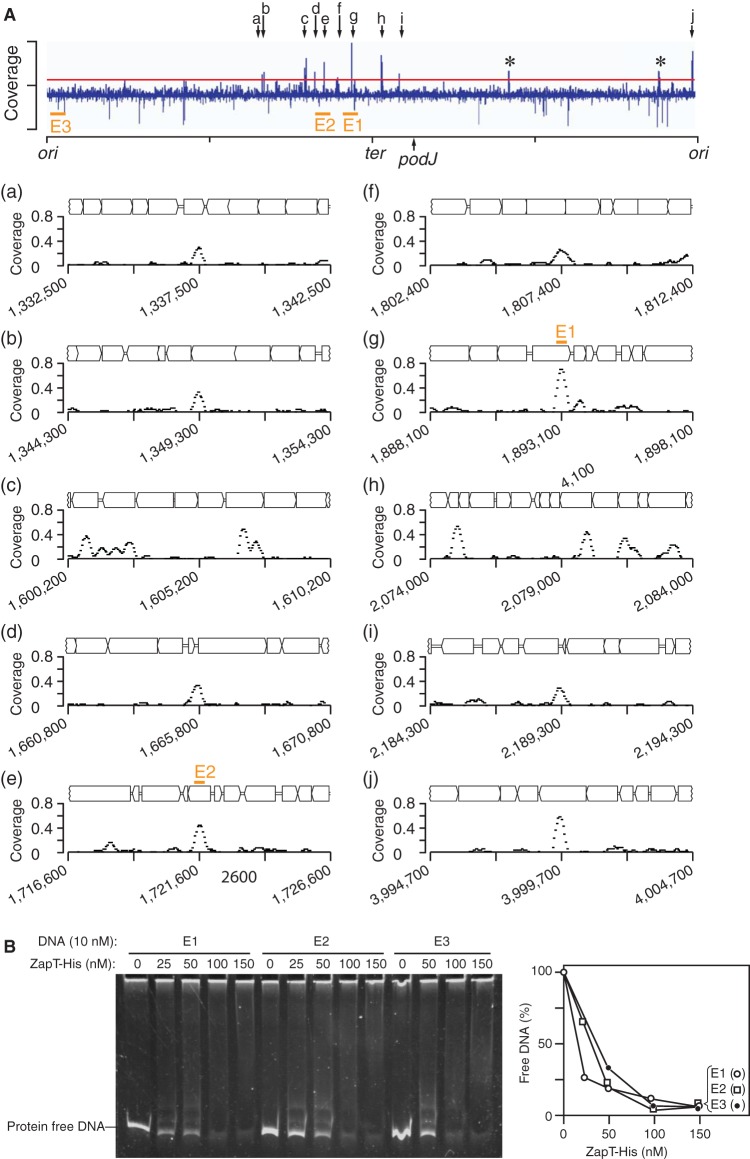
FIG 5.
Genome-wide identification of ZapT binding sites. (A) ChIP-seq was performed using the SHQ10 (ZapT-3F) strain. The coverage of every 50-bp window was normalized to the total number of reads and plotted against the NA1000 genomic position. Asterisks indicate false-positive peaks that appeared in both the SHQ10 and control NA1000 samples. The horizontal red line indicates the threshold. The genomic positions that displayed distinct ChIP peaks in SHQ10 cells but not NA1000 cells are indicated by arrows a to j. Close-up representations of the individual ChIP peaks are also shown with gene arrangements. For simplicity, the names of the genes have been omitted. The x axis indicates the genomic position of the reference NA1000 genome. The origin (ori), terminus (ter), and the podJ locus used for the FROSter assay are indicated. (B) EMSA. The ligand DNA (E1, E2, or E3) (10 nM) was incubated with the indicated amounts of ZapT-His, followed by polyacrylamide gel electrophoresis. DNA was visualized by GelStar staining. The band signals of the protein-free DNA were analyzed using Image J, and the results are plotted as percentages.

