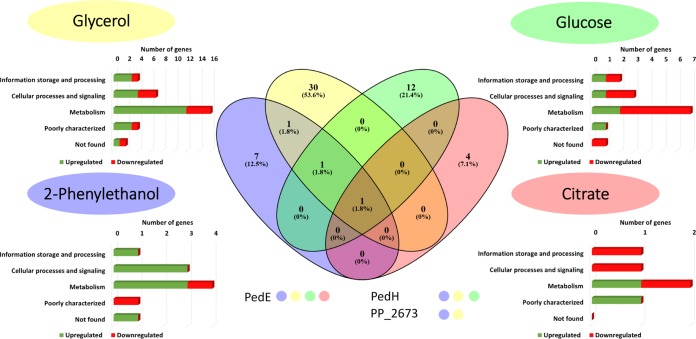
FIG 1.
Venn diagram (middle panel) of proteins in cells of KT2440* showing differential abundance in response to 10 μM La3+ during growth on glycerol, glucose, 2-phenylethanol, and citrate. Proteins that showed up under two or more sets of growth conditions are indicated below the diagram with color coding for classification as follows: yellow dot = glycerol; green dot = glucose; blue dot = 2-phenylethanol; red dot = citrate. Classifications of differentially abundant proteins according to the Cluster of Orthologous Groups database are depicted for each substrate.

