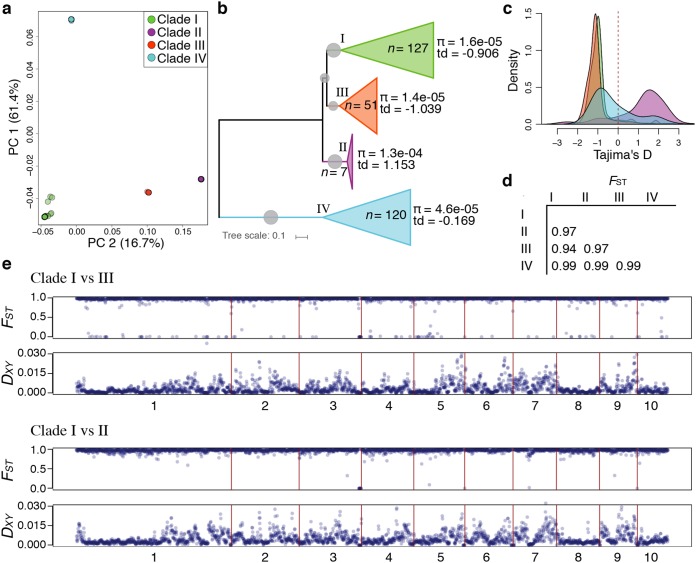
FIG 3.
Population structure and genetic differentiation in Candida auris. (a and b) PCA analysis (a) and phylogenetic tree (b) of 304 C. auris isolates depicting genome-wide population genetic metrics of nucleotide diversity (π) and Tajima’s D (TD) (td in panel b) for each clade. (c) Genome-wide distribution of TD for each clade. (d) Average of genome-wide (5-kb windows) variation in fixation index (FST), for pairwise comparisons in each clade as designated in the first vertical and horizontal row. (e) Genome-wide (5-kb windows) pairwise FST and pairwise nucleotide diversity (DXY) between clade I versus clade III and clade I versus clade II are shown across the 10 largest scaffolds of the B8441 reference genome. All pairwise comparisons of π, TD, FST, and DXY are shown in Fig. S2 in the supplemental material.

