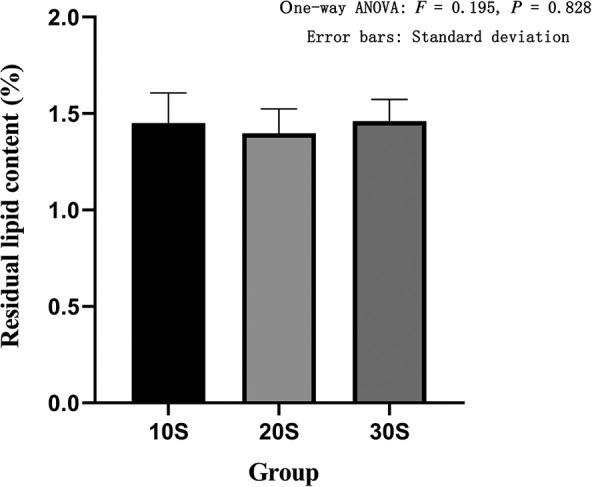
Figure 3.

Residual lipid content in three groups of high pressure washing. The abscissa represents the grouping and the ordinate represents the residual lipid content. Error bars represent standard deviations. One‐way ANOVA was used to compare the residual lipid content between the three groups (F = 0.195, P = 0.828). It was proved that there was no statistical difference in the residual lipid content among the three groups.
