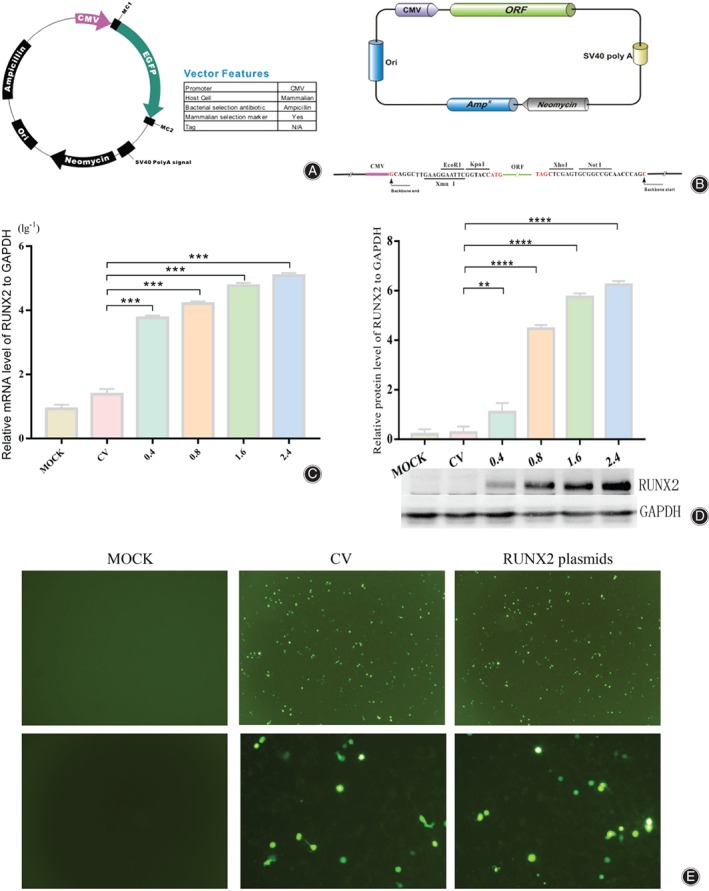
Figure 2.

Construction of the RUNX2 overexpression plasmids. (A)Schematic diagram of control vector (CV); (B) Schematic diagram of RUNX2 plasmids structure, and RUNX2 sequence is between ORF and poly A; (C) After the transfection of CV and RUNX2 plasmids, mRNA of RUNX2 in different transfection concentrations of 0404 cells were examined by qRT‐ PCR. Each group of results were transformed by lg10, and standardized by mock group; (D) After transfecting CV and RUNX2 plasmids, Western Blot shows the level of RUNX2 protein in 0404 cells with different transfection concentrations, which were standardized by 0.4 ng/ul group. (E) The fluorescence level of eGFP in MOCK, CV and RUNX2 plasmids. Photos upside were taken at 40X, while the photos downside were taken at 200X. “***” means P < 0.001.
