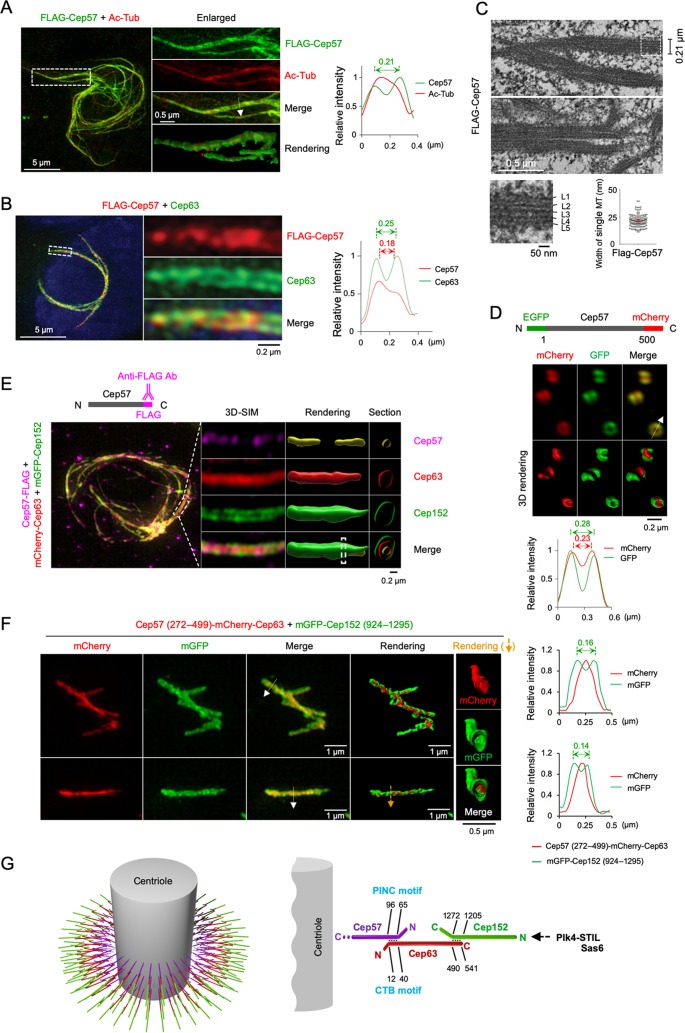
FIG 6.
Cep57 may link the Cep63-Cep152 assemblies to centriolar MTs. (A and B) 3D-SIM analysis of U2OS cells transfected with FLAG-Cep57 and immunostained with anti-FLAG and either anti-acetylated tubulin (Ac-Tub) (A) or anti-Cep63 (B) antibodies. Nuclear DNA was labeled with DAPI (blue). indicate areas of enlargement. Double-headed arrows indicate the peak-to-peak distances for tubular Cep57 and Cep63 signals, and the arrow in the merged image represents the direction of line scan plots for the fluorescence intensity profiles. (C) Correlative light and electron microscopy (CLEM) analysis of U2OS cells expressing FLAG-Cep57. Thin-section transmission electron microscopy (TEM) images reveal the nature of Cep57-induced MT bundles. The widths of MT bundles and individual MTs are measured and provided. The dotted box indicates the area of enlargement for the bottom left image. (D) 3D-SIM imaging was performed using U2OS cells expressing a GFP-Cep57-mCherry construct. Note that the EGFP signal is positioned at the outskirts of the mCherry signal. (E) 3D-SIM analyses of U2OS cells transfected with Cep57-FLAG, infected with adenoviruses expressing mCherry-Cep63 and mGFP-Cep152, and immunostained with anti-FLAG antibody. Images were rendered, and cross sections at the indicated regions (dotted bars) are provided. Somewhat dotted Cep57 signals observed under both settings could be due to limited antibody accessibility in the presence of recruited Cep63 and Cep152. Cep152 exhibited the largest diameters, while Cep57 consistently displayed the smallest diameters (n > 30 cells). (F) 3D-SIM analysis showing in vitro-assembled mGFP-Cep152(924–1295) around the outskirts of Cep57(272–499)-fused mCherry-Cep63 that decorates a cell-free MT bundle induced by the MT-binding C-terminal domain (i.e., residues 272 to 499) of Cep57 (24). An MT was generated by the addition of 100 μM paclitaxel and then incubated with cell lysates expressing a Cep57(272–499)-mCherry-Cep63 fusion and mGFP-Cep152(924–1295). Two representative images from three independent experiments are shown. Arrows in the merged images indicate the direction of line scan plots for the fluorescence intensity profiles shown at the right. Rendered images at the right were generated from the cross section of the region marked by a yellow arrow. Note that Cep152 assembles around MT-binding Cep57(272–499)-mCherry-Cep63 signals. (G) Model illustrating how Cep57 links Cep63-Cep152 self-assembly to the centriolar MTs. The C-terminal domain of Cep57 has MT-binding activity (24), suggesting that it may bind to centriolar MTs directly. The N-terminal PINC motif (18) of Cep57 directly interacts with the N-terminal CTB motif of Cep63 to properly localize to the pericentriolar region. Cep63 has been shown to form a complex with Cep152 and generates a cylindrical architecture around a centriole with the Cep152 N terminus pointing outward (9). This organized assembly in turn recruits Plk4 through a Cep152 N-terminal motif (14), thus allowing Plk4-dependent STIL and Sas6 recruitment and procentriole assembly (15, 16, 35, 36).

