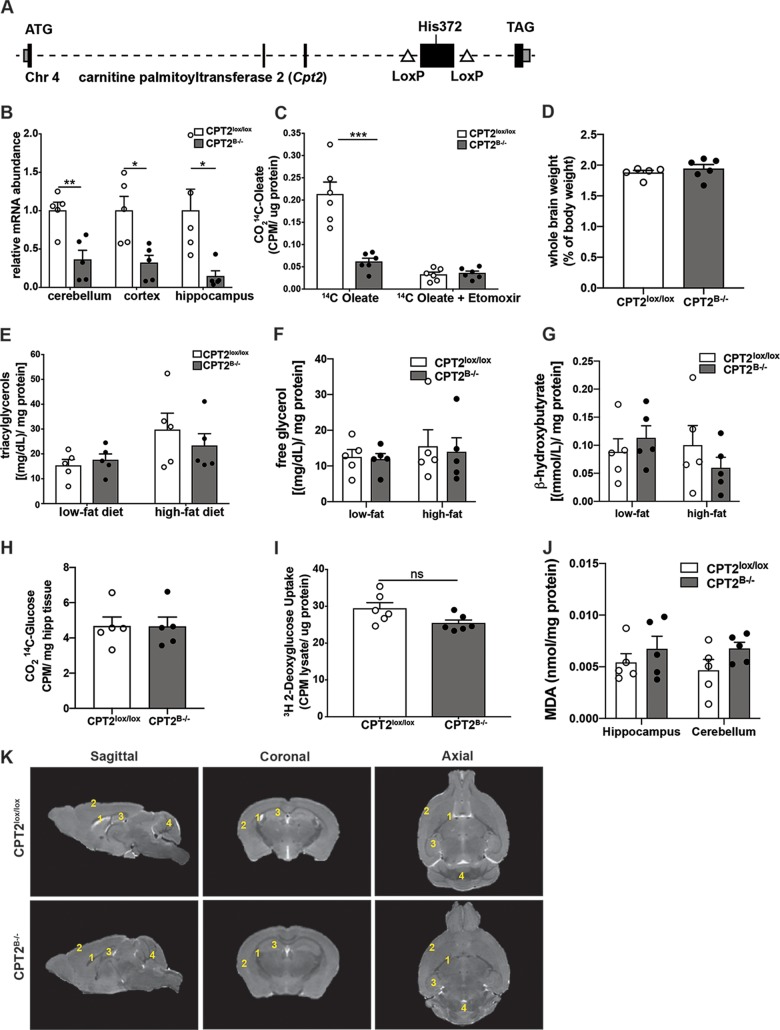
FIG 1.
Development of mice with pan-brain-specific deletion of Cpt2. (A) Scheme depicting gene-targeting strategy for the Cpt2 gene. (Adapted from reference 36.) (B) mRNA abundances of Cpt2 in isolated cerebellum, cortex, and hippocampus from adult CPT2lox/lox and CPT2B−/− mice (n = 5). (C) Oxidation of [1-14C]oleic acid to 14CO2 in P2 primary cortical astrocytes derived from CPT2lox/lox and CPT2B−/− mice (n = 6). [Etomoxir] = 100 μM. CPM, counts per minute. (D) Whole wet weights of CPT2lox/lox (n = 5) brains and CPT2B−/− (n = 6) brains as a percentage of body weight. (E) Concentrations of triacylglycerol in cortical tissue in 18-week-old CPT2lox/lox and CPT2B−/− mice after 15 weeks of low-fat or high-fat diet (n = 5). (F) Concentrations of free glycerol in cortical tissue in 18-week-old CPT2lox/lox and CPT2B−/− mice after 15 weeks of low-fat or high-fat diet (n = 5). (G) Concentrations of β-hydroxybutyrate in cortical tissue in 18-week-old CPT2lox/lox and CPT2B−/− mice after 15 weeks of low-fat or high-fat diet (n = 5). (H) Oxidation of [U-14C]glucose to 14CO2 using approximately 30 mg of ex vivo brain tissue from CPT2lox/lox and CPT2B−/− mice (n = 5). (I) Uptake of [3H]2-deoxyglucose into P2 primary cortical astrocytes derived from CPT2lox/lox and CPT2B−/− mice (n = 6). (J) A TBARS assay used hippocampus and cerebellum tissues from CPT2lox/lox and CPT2B−/− mice (n = 5). (K) Representative MRI renderings of sagittal, axial, and coronal planes from CPT2lox/lox and CPT2B−/− mice. 1, lateral ventricles; 2, cortex; 3, hippocampus; 4, cerebellum. The data are expressed as means and standard errors of the mean (SEM). The data shown were analyzed using Student two-tailed t tests. *, α = 0.05; **, α = 0.01; ***, α = 0.001; ns, not significant.

