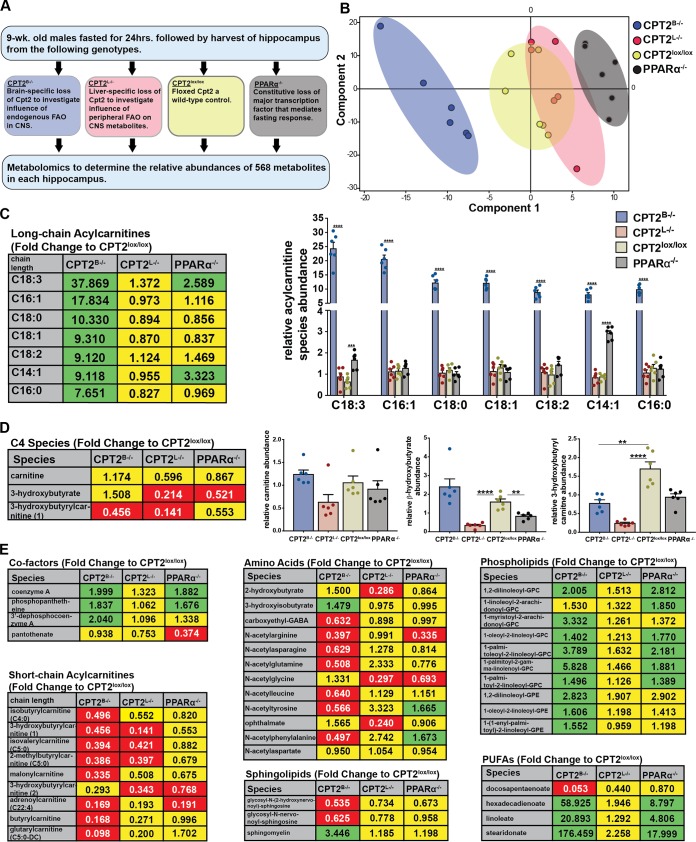
FIG 5.
Loss of CPT2 in the brain results in elevated long-chain acylcarnitines in relative metabolite summary. (A) Flowchart describing unbiased mass spectrometry metabolomics in hippocampi from 9-week-old male 24-h-fasted mice across genotypes. (B) PCA summarizing similarities and dissimilarities of metabolites across genotypes of the relative metabolite summary. (C) Fold changes and relative abundances of long-chain acylcarnitines in whole hippocampi from 24-h-fasted 9-week-old CPT2B−/−, CPT2L−/−, and PPARα−/− mice in comparison and normalized to CPT2lox/lox mice (n = 6). (D) Fold changes and relative abundances of fatty acid-associated metabolites in whole hippocampi from 24-h-fasted 9-week-old CPT2B−/−, CPT2L−/−, and PPARα−/− mice in comparison and normalized to CPT2lox/lox mice (n = 6). (E) Fold changes and relative abundances of additional metabolites in whole hippocampi from 24-h-fasted 9-week-old CPT2B−/−, CPT2L−/−, and PPARα−/− mice in comparison and normalized to CPT2lox/lox mice (n = 6). (C to E) (Left) The data are represented as fold changes in CPT2B−/−, CPT2L−/−, and PPARα−/− mice in comparison to CPT2lox/lox mice. The statistical significance of the metabolites shown was determined using the two-stage false-discovery rate (FDR) method of Benjamini, Krieger, and Yekutieli with an FDR (Q) of 10%. Fold changes in green boxes are significantly increased, fold changes in red boxes are significantly decreased, and fold changes in yellow boxes are not significantly affected by genotype. (Right) The same data are represented as means of relative species abundance plus SEM in the graphs. **, α = 0.01; ****, α = 0.0001.

