. 2020 Apr 27;61(3):242–249. doi: 10.4111/icu.2020.61.3.242

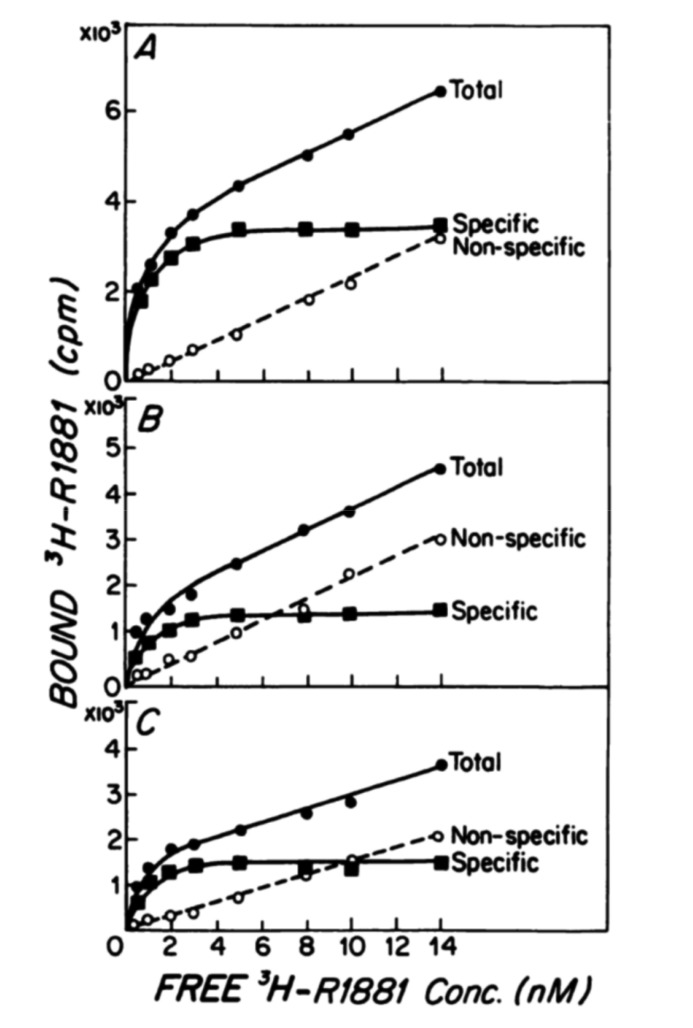
Fig. 1. Original graph from Ho et al. [16] published in 1985 describes the binding capacity for cytosolic androgen receptors (ARs) from three differently designated lobes of the rat prostate, as assessed by radio immune assay. Thus, these values represent the AR capacity within the cytosol in three different lobes, as the aim of the study was to assess the distribution of AR in the prostate. The saturating Gompertzian curve shown is what is naturally expected in such experiments, as new AR formation has ceased in the fixed and minced supernatant that was investigated. Original graph from Ho et al. J Androl 1985;6:279-90 [16], with permission of John Wiley & Sons.

Fig. 1