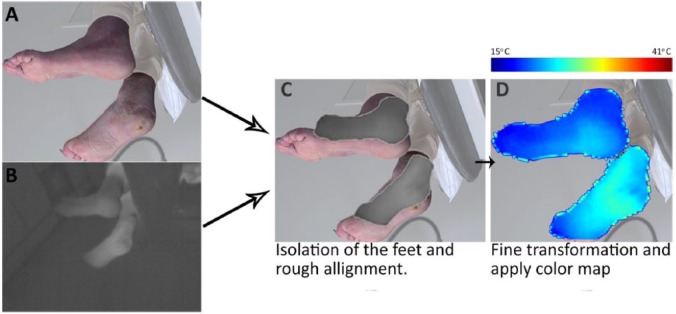
Figure 2.
Graphic overview of the transformation process to replace the original texture map (A) with the IR image (B). (C) The feet were cut out of the images using Photoshop and the thermal images were roughly placed on the texture map. (D) The thermal images were transformed to cover the appropriate surface of the texture map and a color map was applied. The color map ranged from 15°C (dark blue) to 41°C (dark red).

