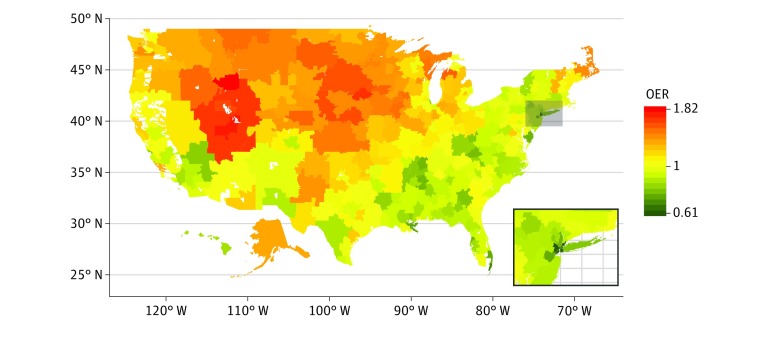
Figure 1. Observed to Expected Ratios (OERs) for Rates of Primary Total Knee Arthroplasty Among White Medicare Beneficiaries by Health Referral Region.
Ratios greater than 1.0 indicate higher than expected rates of total knee arthroplasty, while ratios less than 1.0 indicate lower than expected rates. Insert shows the New York City region.

