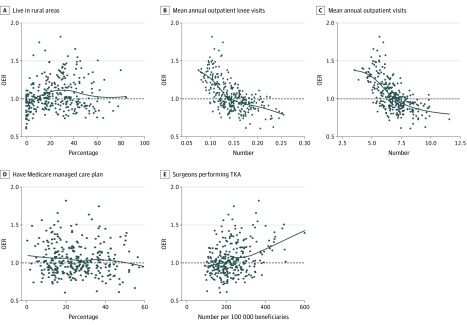
Figure 2. Associations Between Observed to Expected Ratios (OERs) for Rates of Primary Total Knee Arthroplasty (TKA) and Measures of Access to Care Among Health Referral Regions.
Access to care measures included (A) the percentage of beneficiaries living in rural areas, (B) the mean annual number of outpatient visits for knee concerns or (C) any outpatient visit, (D) the percentage of beneficiaries in Medicare managed care plans, and (E) the number of surgeons performing TKA procedures per 100 000 beneficiaries. Each black dot represents a health referral region; black lines, locally estimated scatterplot smoothing curves of the association.

