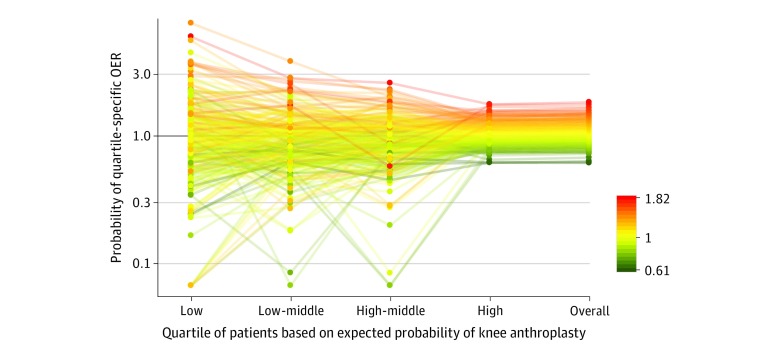
Figure 3. Observed to Expected Ratios (OERs) for Rates of Primary Total Knee Arthroplasty (TKA) in Each Health Referral Region Among White Medicare Beneficiaries by Expected Probability of TKA.
Expected probabilities were stratified into quartiles from very low (on the left) to highest (on the right), and quartile-specific OERs were computed for each region. Each line represents a health referral region color coded to its overall OER. Health referral regions with very low overall OERs (green) had low OERs regardless of the absolute probability of TKA among beneficiaries (low vs low-middle vs high-middle vs high; ie, green is predominantly below 1.0 in all 4 groups). By contrast, health referral regions with high overall OERs (orange/red) had higher OERs regardless of the absolute probability of TKA (ie, orange/red is predominantly above 1.5 in all 4 groups). These patterns indicate that the overall OER is associated with a region across beneficiaries with a range of likelihoods of TKA.

