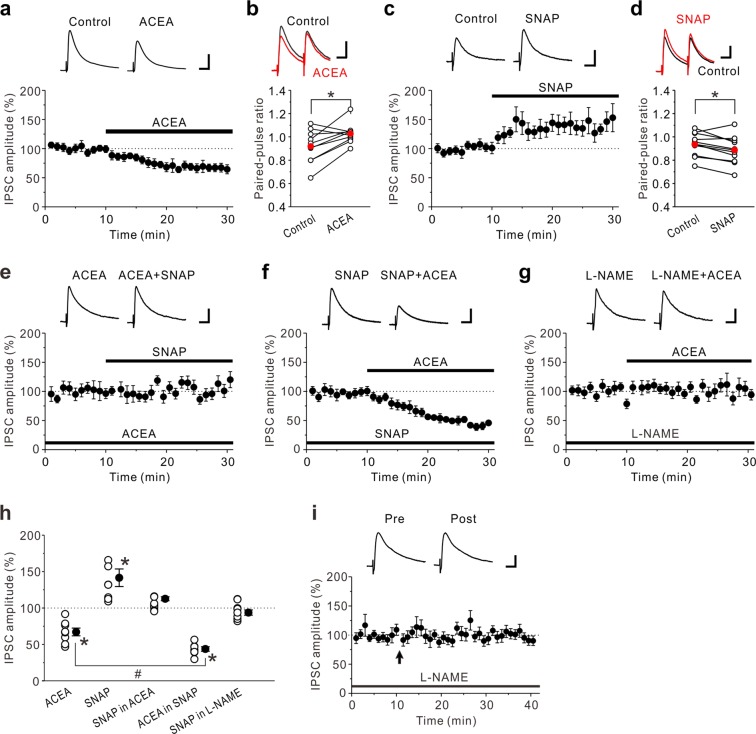
Figure 3.
Effects of CB1R agonist and NO donor on eIPSCs in the insular cortex. (a) 3 μM ACEA decreased eIPSC amplitudes (n = 8). (b) Summary scatter plots of PPF before (Control) and during application of 3 μM ACEA (n = 10). ACEA increased PPF. (c) 200 μM SNAP increased eIPSC amplitudes (n = 8). (d) Summary scatter plots of PPF before (Control) and during application of 200 μM SNAP (n = 10). SNAP decreased PPF. (e) In the presence of 3 μM ACEA, 200 μM SNAP had no effect on eIPSC amplitudes (n = 8). (f) In the presence of 200 μM SNAP, 3 μM ACEA markedly decreased eIPSC amplitudes (n = 7). (g) In the presence of 100 μM L-NAME, 3 μM ACEA had no effect on amplitude of eIPSCs (n = 9). (h) Summary scatter plots of eIPSCs obtained from the experiments shown in (a,c,e–g). Paired t-test, *p < 0.02 compared to control response. Unpaired t-test, #p < 0.01. (i) In the presence of 100 μM L-NAME, LTPGABA caused by the prolonged HFS was completely abolished (n = 8). The insets show averages of ten consecutive current traces before (pre) and 25–30 min after the prolonged HFS (post). The prolonged HFS is indicated by an arrow. (a,c,e–g) The insets show averages of ten consecutive current traces before and 15–20 min after drug applications. (a-g,i) Scale bar represents 50 pA and 50 ms.

