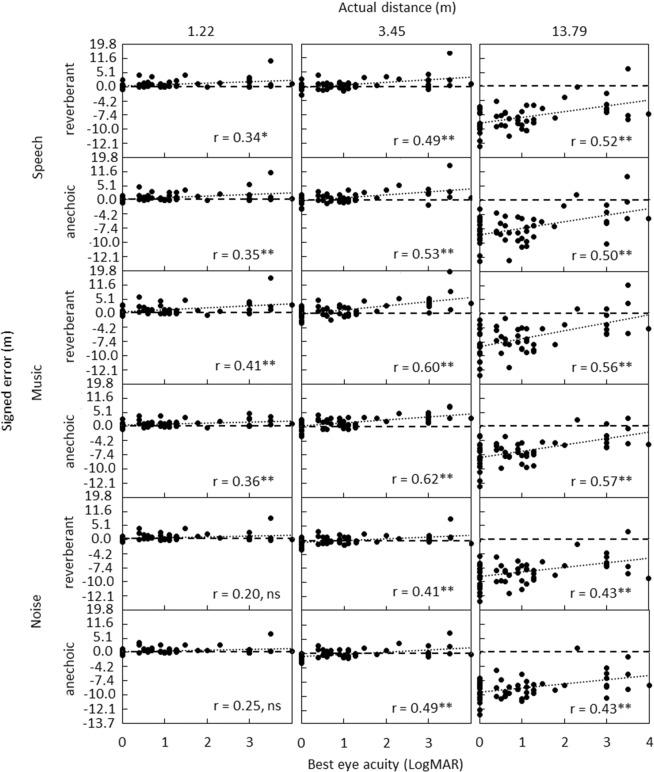
Figure 2.
Individual judged distance signed error values plotted against best eye visual acuity. Rows of panels from top to bottom show results for simulated anechoic and reverberant rooms for speech, music, and noise. The left, middle, and right panels show results for a subset of simulated distances of 1.22, 3.45 and 13.79 m, respectively. LogMAR = 0 represents best visual acuity and 4 the worst. Linear fits to the data are shown by dotted lines. Perfect performance is indicated by the long-dashed lines. Pearson r values are reported in the bottom-right corner of each panel (in this and subsequent figures and Table 1, ns = non-significant, * = p<0.05, ** = p<0.01).

